
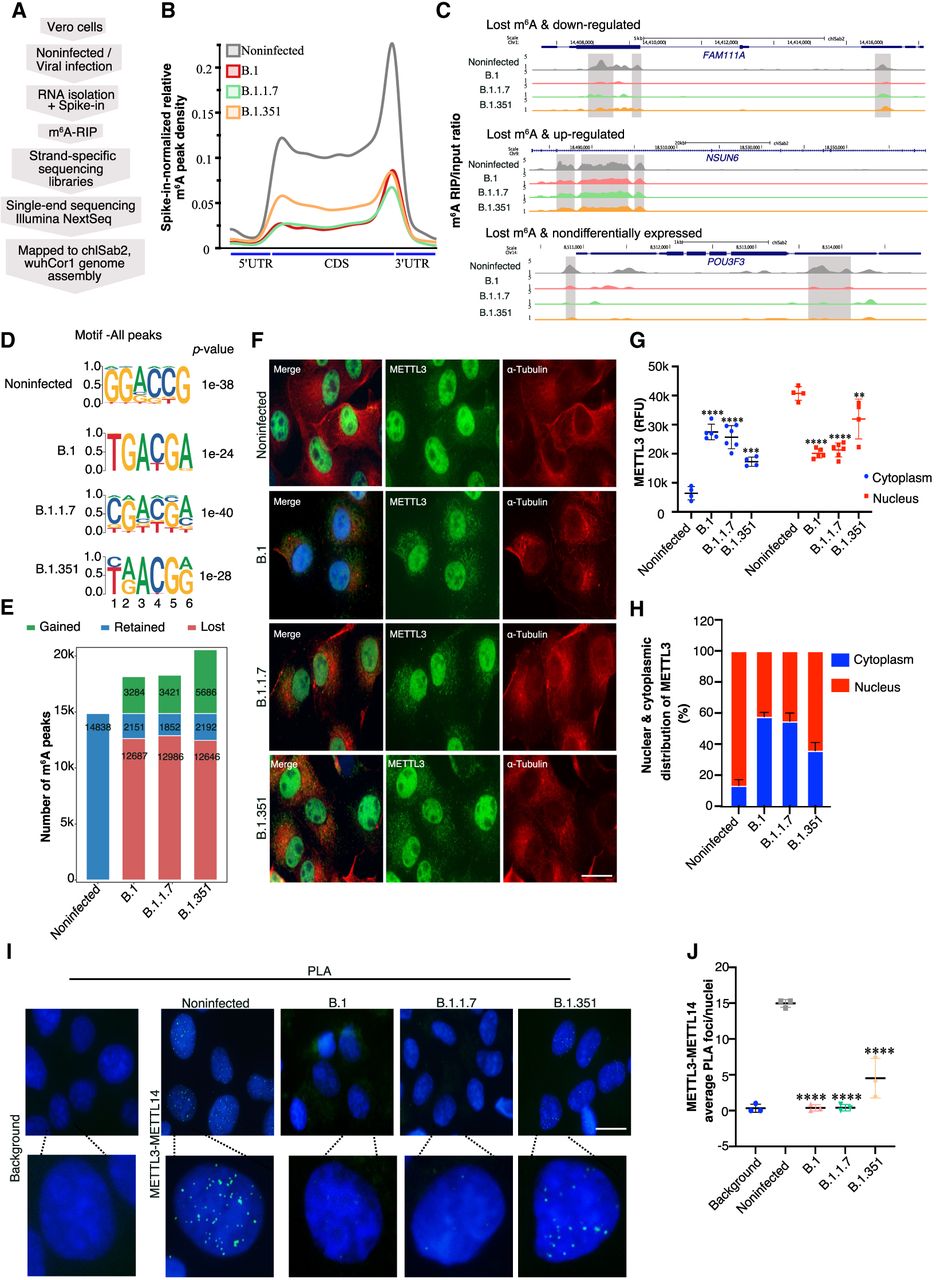
Variant-specific changes in cellular RNA m6A level after viral infection. (A) Flow chart describing the m6A RIP-seq protocol. (B) Metagene analysis showing spike-in normalized relative m6A peak density at host genes in noninfected and SARS-CoV-2-infected Vero cells (variants as specified by colors). (C) Genome browser screenshots showing the ratio of m6A RIP/input for three different genes in noninfected and SARS-CoV-2-infected (variants as specified) Vero cells. Ratio tracks were calculated using spike-in normalized counts per million (CPM). m6A peak regions identified using the MACS peak caller software in noninfected cells are highlighted using gray boxes. (D) Identified motifs from de novo motif analysis of peaks in noninfected and infected cells. (E) The total number of peaks classified as retained, gained, or lost postinfection with the SARS-CoV-2 variants are indicated and compared with the noninfected condition. (F–H) METTL3 localization. (F) METTL3 and α-tubulin coimmunostaining in Vero cells that were either noninfected or infected with SARS-CoV-2 variants (as denoted). Scale bar is 20 μm. (G) METTL3 intensities (in relative fluorescence units [RFU]) derived from the immunostainings performed in F. METTL3 RFU in the nucleus (red) and cytoplasm (blue) were estimated using ImageJ, using DAPI marking the nucleus and α-tubulin staining the cytoplasm as references. Data are shown as mean ± SD. Data presented from multiple experiments with the total number of cells counted, n = <70. One-way ANOVA test was performed; (**) P < 0.01, (***) P < 0.001, (****) P < 0.0001. (H) Distribution of METTL3 in the nucleus and cytoplasm calculated from the percentage of RFU intensities measured as described in G. Data are shown as mean ± SD. (I,J) METTL3–METTL14 interaction. (I) Proximity ligation assay (PLA) in noninfected and SARS-CoV-2-infected Vero cells (variants as indicated) depicting METTL3 and METTL14 PLA foci in the nucleus (marked by DAPI). The background control shows PLA with only the METTL3 antibody. Scale bar is 20 μm. (J) Quantification of METTL3–METTL14 PLA foci as detected in I. The number of PLA foci/nuclei are shown as mean ± SD. Data presented from multiple experiments with the total number of cells counted, n = <100. One-way ANOVA test was performed; (****) P < 0.0001.


