
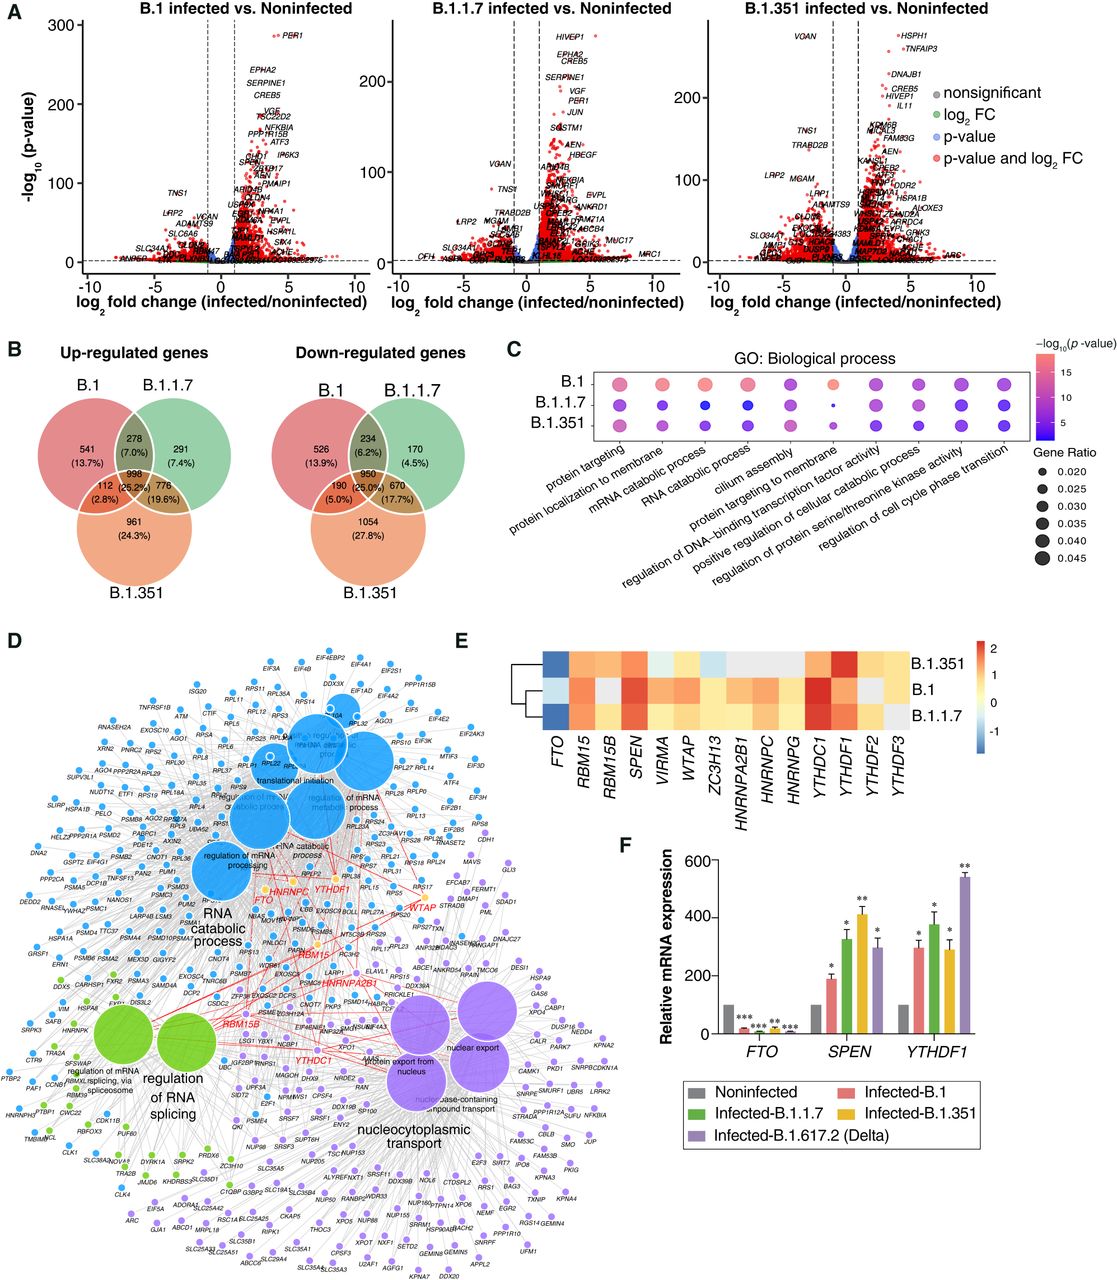
Gene expression changes postinfection with different variants of SARS-CoV-2. (A) Volcano plots showing gene expression changes and significance (−log10 scale) in SARS-CoV-2-infected versus noninfected cells. Dashed lines indicate the significance threshold (adjusted P-value < 0.01) and log2 fold-change threshold (abs log2 fold-change > 1). Differentially expressed genes are highlighted in red, and labels indicate some of the common differentially expressed genes across all conditions. (B) Venn diagram comparison of up- and down-regulated genes across variants. (C) Top enriched Gene Ontology (GO) term biological processes after infection. The size of the dots represents the enrichment of genes with a GO term, colored according to their significance level. (D) ClueGO clustering and visualization of common terms associated with m6A-related genes across any pair of SARS-CoV-2 variants. m6A genes that are deregulated across variants are highlighted in red. (E) Heat map of m6A-related genes, with gray boxes indicating nondifferentially expressed genes and colors indicating the log2 fold-change values of significantly deregulated genes in at least two variants. (F) Relative mRNA expression of m6A-related genes in noninfected Vero cells and Vero cells infected with B.1, B.1.1.7, B.1.351, and B.1.617.2 (Delta) variants of SARS-CoV-2. TBP and POL2RG were used to normalize the qPCR data. Data are shown as mean ± SD of three replicates (n = 3). Statistics: two-tailed paired t-test; (*) P < 0.05, (**) P < 0.01, (***) P < 0.001.


