
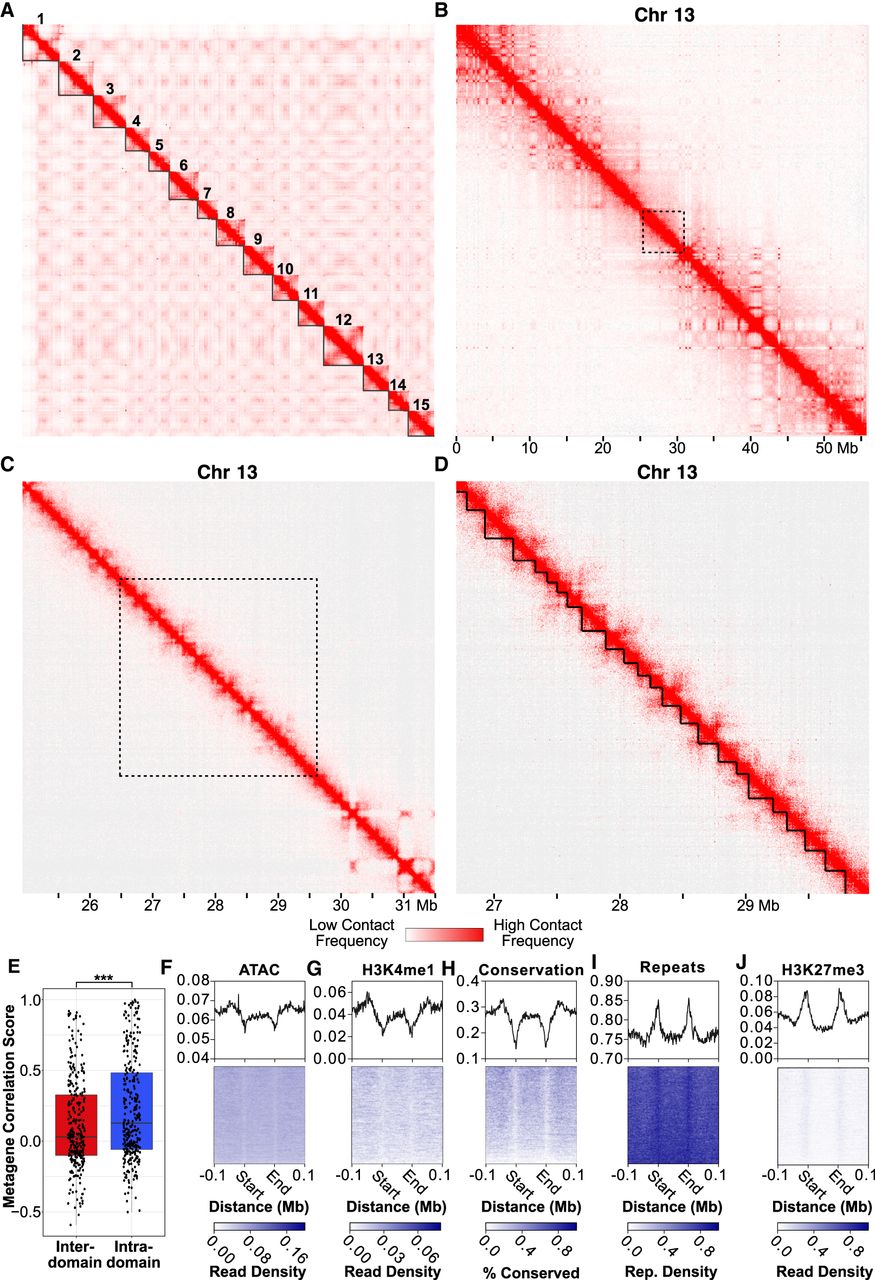
Hi-C data reveal hierarchical chromatin architecture in the Hydra genome. (A) Hi-C contact map for the H. vulgaris strain AEP assembly reveals 15 pseudochromosomes with high levels of both inter-chromosomal interactions between presumptive centromeric regions and intra-chromosomal interactions between centromeric and telomeric regions. (B) The chromatin interaction map for Chromosome 13 reveals megabase-scale chromatin compartments. The black dotted lines indicate the region visualized in the subsequent figure panel. (C) Kilobase-scale interaction domains can be found within a single megabase-scale compartment. (D) Representative depiction of predicted kilobase-scale chromatin interaction domains in Hydra (black lines). (E) Boxplot/scatterplot depicting the correlation in expression for adjacent gene pairs show that gene pairs within the same domain (intra-domain pairs) were significantly more similar than pairs that spanned a domain boundary (inter-domain pairs; Welch two-sample t-test P-value = 6.93 × 10⁻⁵). (F–J) Predicted domain boundaries fall within regions of heterochromatin. Domain boundaries are associated with reduced chromatin accessibility (F), H3K4me1 (G), and sequence conservation (H) and with elevated repeat element density (I) and H3K27me3 (J).


