
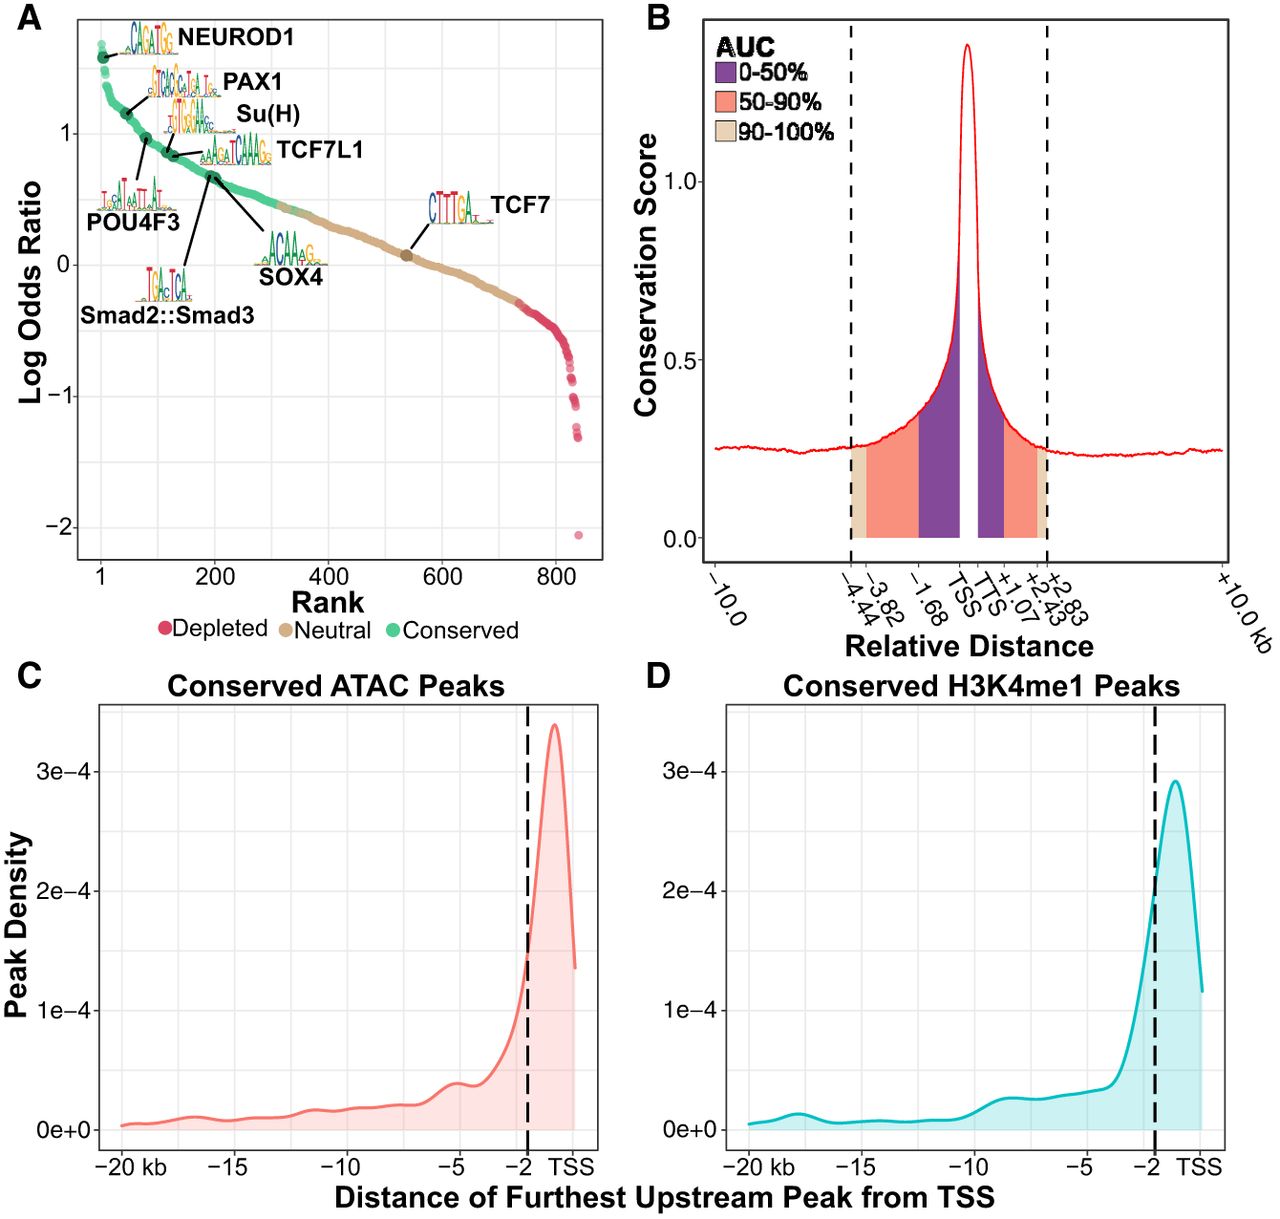
Phylogenetic footprinting reveals conserved regulatory elements and transcription factor (TF) binding sites across the Hydra genome. (A) Quantification of TF binding motif conservation across four Hydra genomes. A positive log odds value indicates the nonshuffled motif had a higher conservation rate than its shuffled control. Statistical significance was evaluated using a chi-square test with an FDR cutoff of 0.01. (B) The distribution of sequence conservation levels around genes suggests that a sizable minority of promoter-proximal CREs extends farther than 2 kb from the nearest TSS. The conservation score represents the average number of non-AEP hydrozoan genomes that had the same base as the AEP assembly at a given locus. (AUC) Area under the curve; (TSS) transcription start site; (TTS) transcription termination site. Gene bodies were excluded from the AUC calculation. (C,D) Distribution plots summarizing the distance from the furthest upstream CRE for each gene to the predicted target TSS based on either ATAC-seq (C) or H3K4me1 CUT&Tag (D). Dotted vertical lines demarcate 2 kb from the TSS.


