
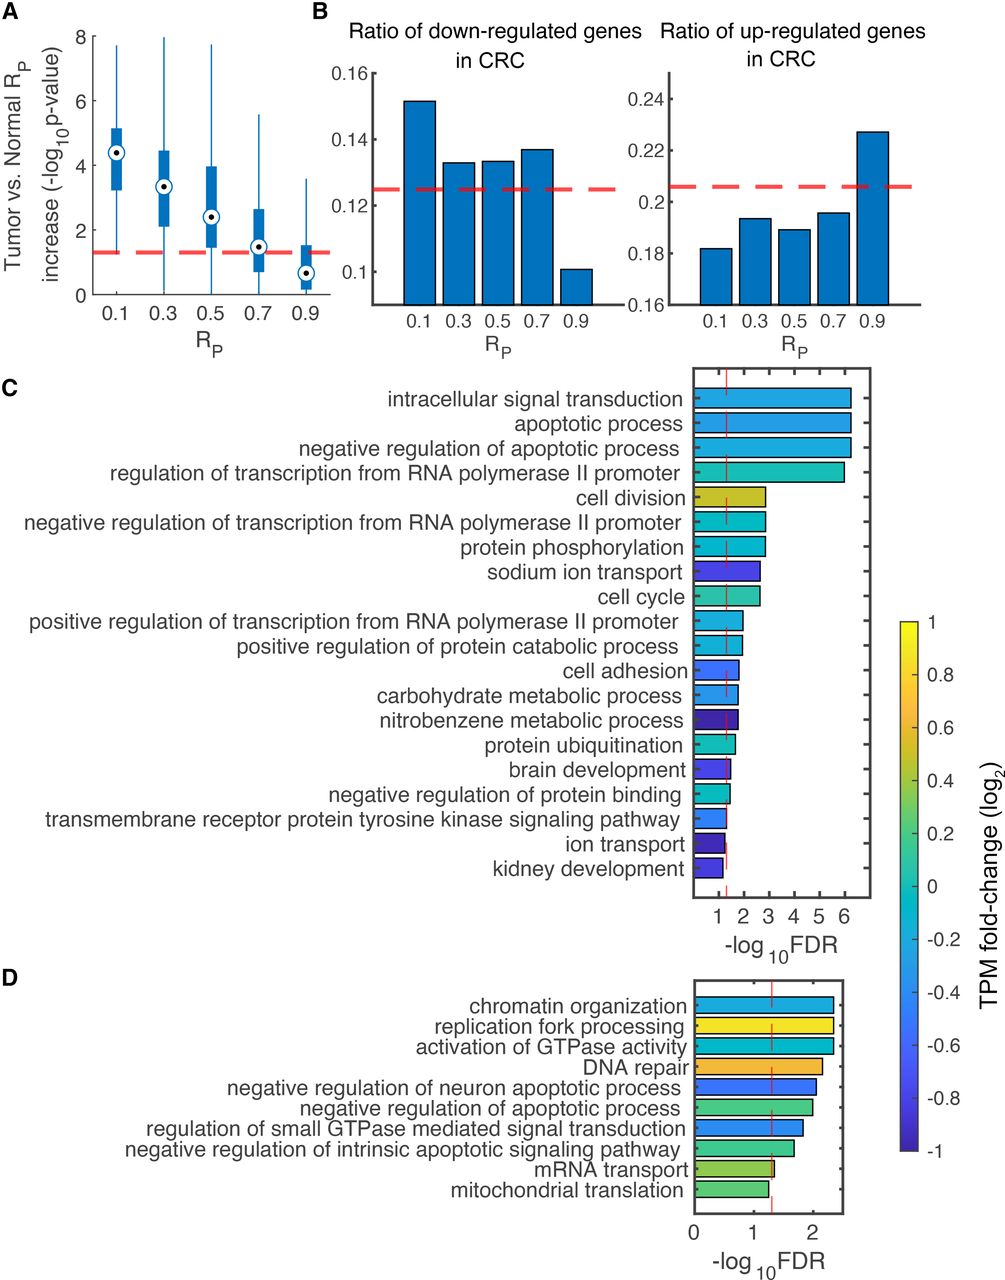
Correlation between differential gene expression and CCN hierarchy in cancer. (A) Boxplot showing significance [−log10(P-value)] of RP increase from normal colon to CRC. Loci were grouped according to RP of normal colon. For instance, 0.1 in the x axis means the annular area defined by a radius ranging from 0 to 0.2 in the Poincaré disk. The horizontal dashed line indicates −log10(0.05). (B) Bars showing the ratio of down-regulated genes (left) and that of up-regulated genes (right) in CRC for genes in each group. The horizontal dashed lines indicate the proportion of corresponding differentially expressed genes in all genes. Enriched functions for colon-specific (C) and CRC-specific genes (D) in the highest hierarchy class. For each bar representing a pathway, the average TPM fold change (log2) of involved genes from normal colon to CRC is manifested by the bar color. The vertical dashed lines indicate FDR-adjusted P-value equaling 0.05.


