
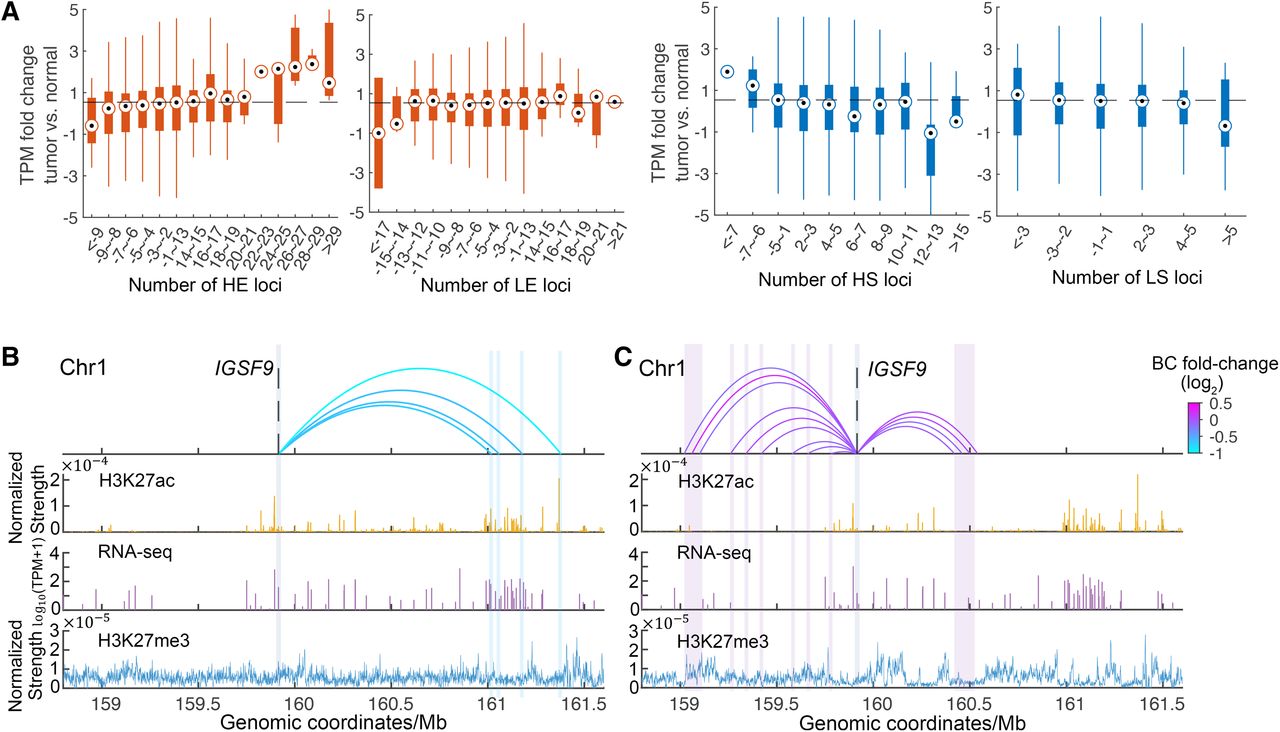
Correlation between gene expression changes and rewired contacts in cancer. (A) In each box, the x coordinate is the number of loci that a gene significantly (P < 0.05) lost or gained contacts with from normal colon to CRC; the y coordinate is TPM fold change (log2). A negative or a positive x coordinate means losing or gaining contacts with loci of corresponding type. HE and LE denote loci containing H3K27ac-peaks (enhancer-like) in the highest hierarchy class and those in the lowest hierarchy class, whereas HS and LS denote H3K27me3-rich (silencer-like) loci in the highest hierarchy class and those in the lowest hierarchy class, respectively. Changes of genomic tracks from normal colon (B) to colorectal cancer (C) for the gene IGSF9. Significantly (P < 0.05) changed Hi-C contacts from normal colon to colorectal cancer at the gene promoter bait are shown in the top panel, where decreased and increased contacts are shown in panels B and C, respectively. The colors of contact traits represent betweenness centrality (BC) fold-change from normal colon to colorectal cancer. The second and the third panels are H3K27ac signals and RNA-seq data, respectively. TPM is averaged in the normal colons and the CRC samples from the TCGA database. The bottom panels are H3K27me3 signals. The ChIP-seq signals were normalized by corresponding sequencing depth.


