
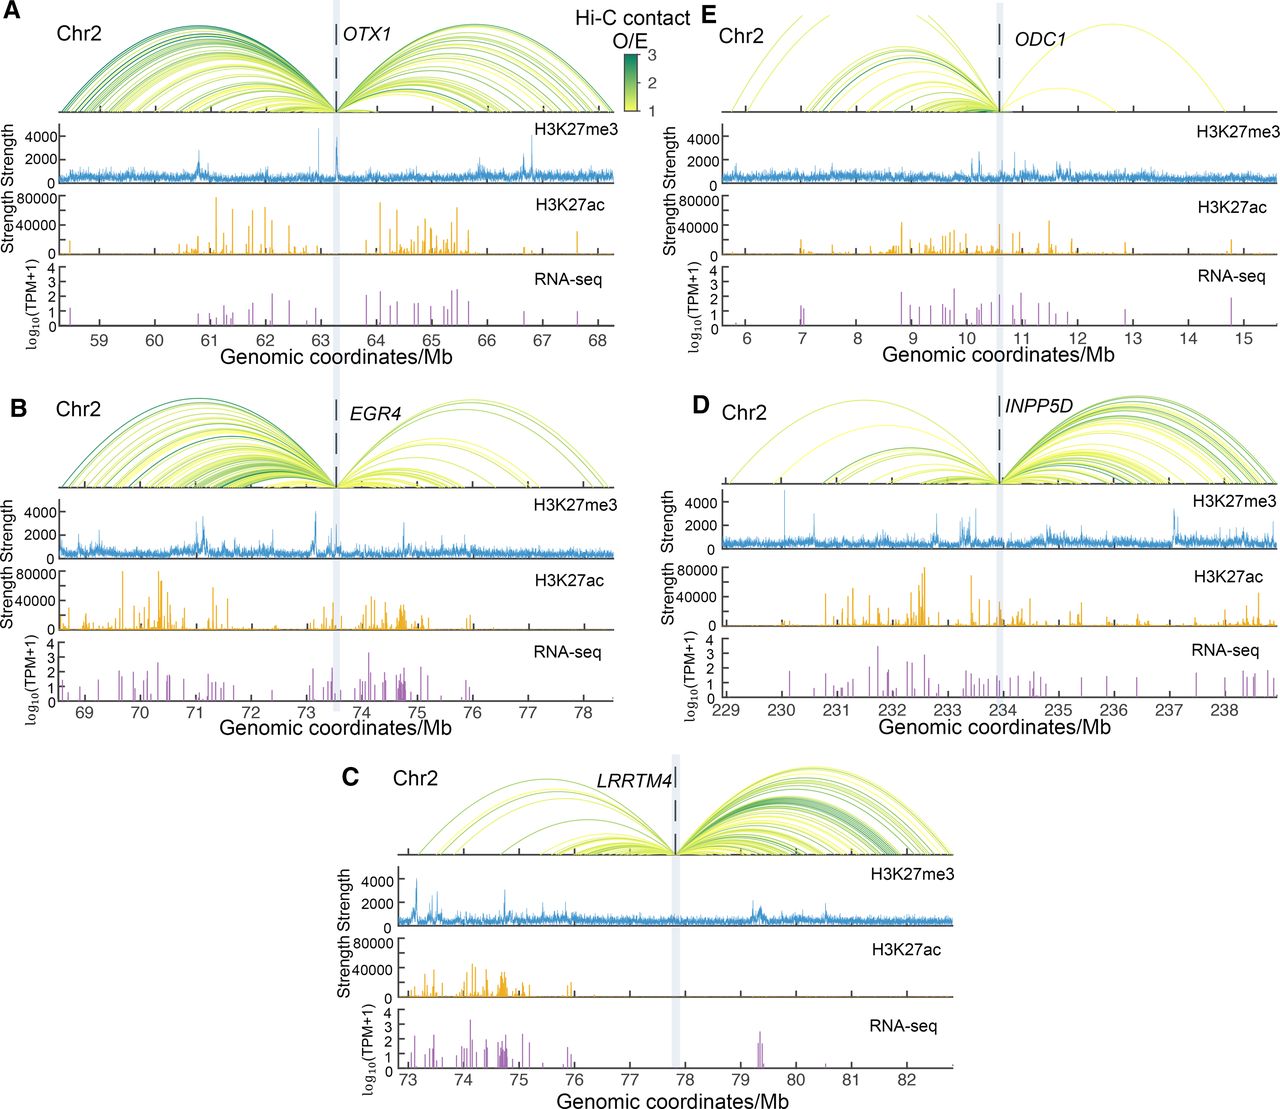
Genomic tracks of exemplary genes from each hierarchy class. Genomic tracks of genes OTX1, EGR4, LRRTM4, INPP5D, and ODC1 from the hierarchy class 1, 2, 3, 4, and 5 in the normal colon are shown in panels A, B, C, D, and E, respectively. The top panels are virtual 4C traits at the gene promoter baits; Hi-C contacts with observed/expected (O/E) strength larger than 1 are displayed. The O/E contacts were calculated as the contact strength divided by the average contact strength at corresponding sequential distances. The colors of 4C traits represent the O/E contact strength. The second and the third panels are H3K27me3 and H3K27ac signals, respectively. The bottom panels are RNA-seq data; the y coordinates are log10(TPM + 1). TPM is averaged in the normal colons from the TCGA database.


