
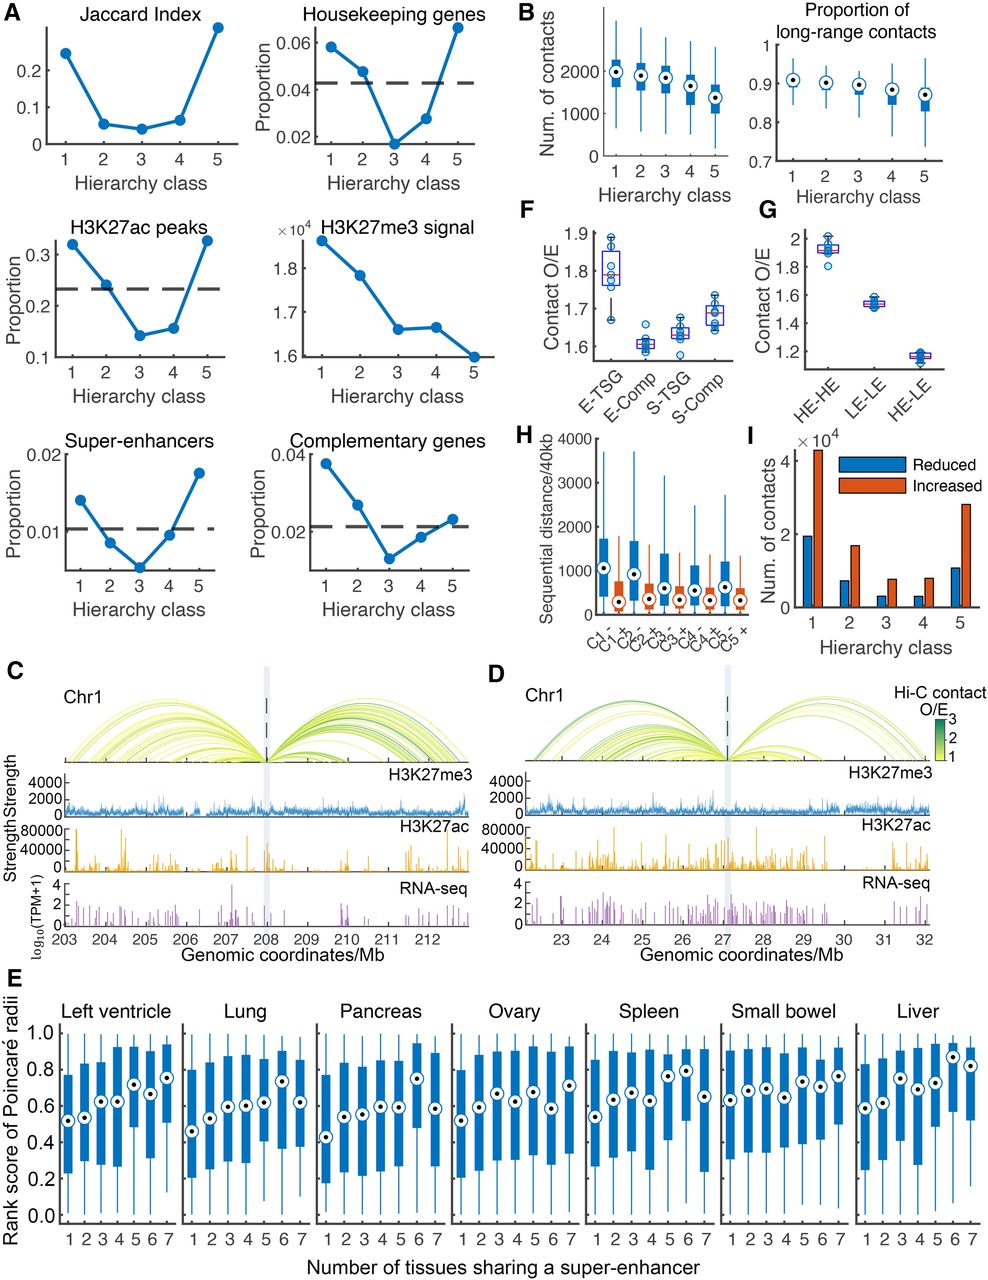
Properties of chromatin segments in each hierarchy class. (A) Proportion of loci (40 kb segments) containing H3K27ac peaks, super-enhancers, colon complementary genes, or housekeeping genes in each hierarchy class, as well as the Jaccard index (JI) and the average H3K27me3 signal of each hierarchy class. Numbers beneath the x-axis denote the hierarchy classes for normal colon (e.g., class 1 is the highest hierarchy class). The horizontal dashed lines indicate the expected proportion of loci containing regulatory elements/genes in all loci. (B) Boxplots showing the number of formed contacts and the proportion of long-range (>4 Mb) contacts for loci in each hierarchy class for normal colon. Genomic tracks of exemplary super-enhancers (SEs) from the hierarchy class 1 (C) and class 5 (D) in the normal colon. The top panels are virtual 4C traits at the SE center baits; Hi-C contacts with observed/expected (O/E) strength larger than 1 are displayed. The O/E contacts were calculated as the contact strength divided by the average contact strength at corresponding sequential distances. The colors of 4C traits represent the O/E contact strength. The second and the third panels are H3K27me3 and H3K27ac signals, respectively. The bottom panels are RNA-seq data, the y coordinates are log10(TPM + 1). (E) Boxplots showing rank scores by RP for SEs in each tissue. For one primary tissue, each SE was classified into groups by the number of tissues sharing it. The rank score of a SE was calculated as its rank in RP divided by the number of entries in RP. A smaller rank score means a higher relative hierarchy status for a SE. (F) Boxplots showing the observed/expected (O/E) contact frequencies between colon tissue-specific genes (TSGs) or colon complementary genes and potential regulatory elements in the highest hierarchy class in normal colon. “E,” “S,” and “Comp” denote loci containing H3K27ac peaks (enhancer-like), with rich H3K27me3 signals (silencer-like) and containing colon complementary genes, respectively. (G) Boxplot showing O/E contact frequencies within the HEs, within the LEs, between HEs and LEs in normal colon. HE and LE denote loci containing H3K27ac peaks (enhancer-like) in the highest hierarchy class and those in the lowest hierarchy class, respectively. (H) Boxplots showing sequential distances of significantly changed contacts from normal colon to CRC for each hierarchy class on Chromosome 1. For instance, “C1−” denotes the decreased contacts involving loci in the highest hierarchy class, whereas “C5+” denotes the increased contacts involving loci in the lowest hierarchy class. (I) Bars showing numbers of significantly changed E-P and S-P contacts in each hierarchy class from normal colon to CRC. E-P and S-P denote contacts between promoter loci and loci containing H3K27ac-peaks (enhancer-like) and between promoter loci and H3K27me3-rich (silencer-like) loci, respectively.


