
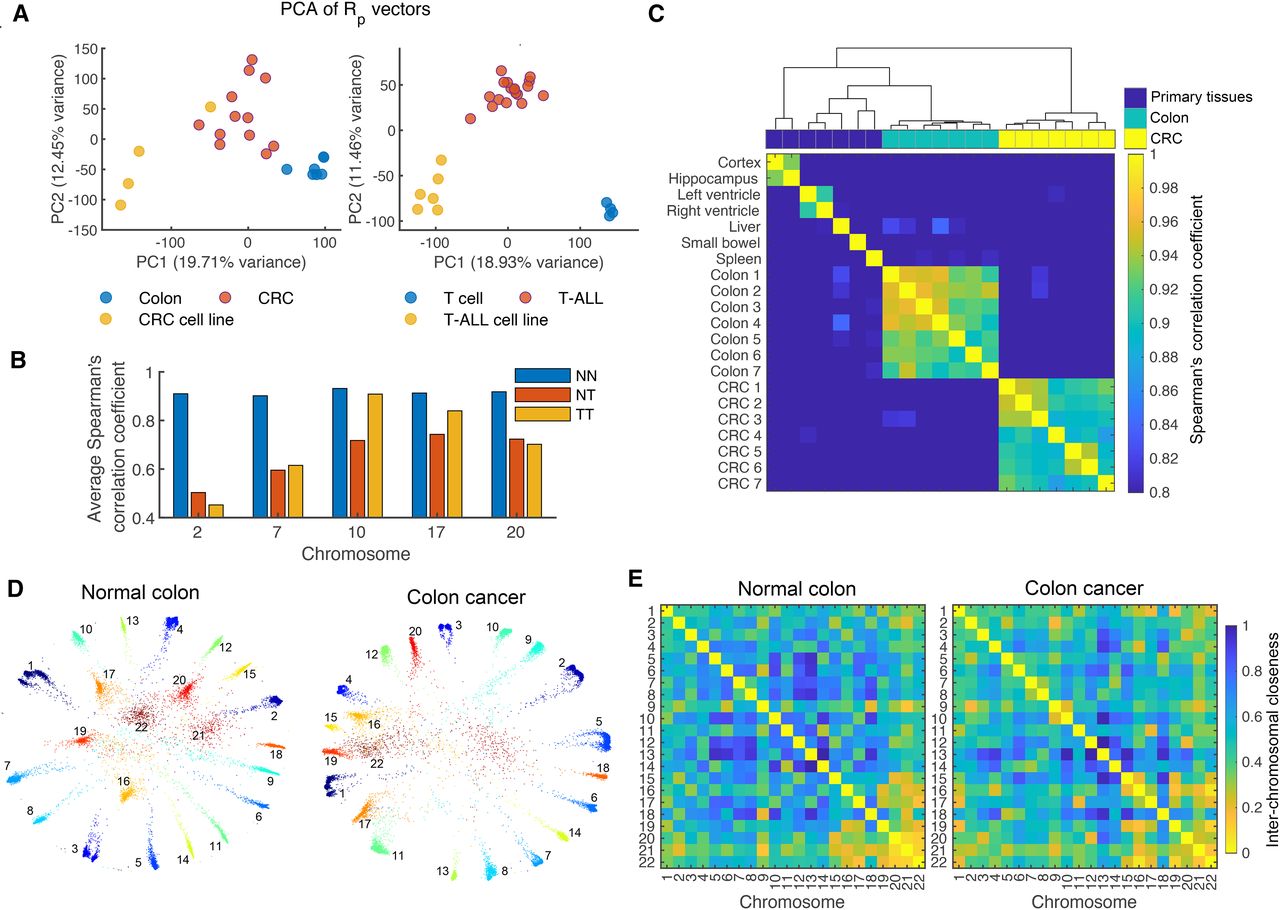
CCN hierarchy disorder in cancer. (A) Principal component analysis (PCA) for RP vectors of samples in CRC and T-ALL data sets. The PCA is conducted on RP values of all 40-kb bins in the entire genome. Each point represents a sample in PC space defined by the first two principal components. (B) Bar graphs showing the average Spearman's correlation coefficients of RP between all pairs of normal colons (NN), between all pairs of colon tumors (TT), and between each normal colon and each colon tumor (NT). (C) Rank similarity in RP among samples including primary tissues, normal colons, and colon tumors. Each unit color in the heatmap represents the value of Spearman's correlation coefficient between RP vectors of corresponding sample pair. Samples were clustered using the Ward's hierarchical clustering method. The heatmap was derived from the intrachromosomal CCNs of Chromosome 10, therein the normal colon and tumor sets both have conserved hierarchy order as shown in B. (D) Embedded structures of whole chromatin contact networks for a pair of normal colon (left) and colon tumor (right) of one individual. Chromosome numbers were annotated alongside corresponding chromosomes in embedded structures. (E) Interchromosomal closeness matrices corresponding to (D). Each heatmap entry ranging from 0 to 1 indicates the closeness between each pair of chromosomes.


