
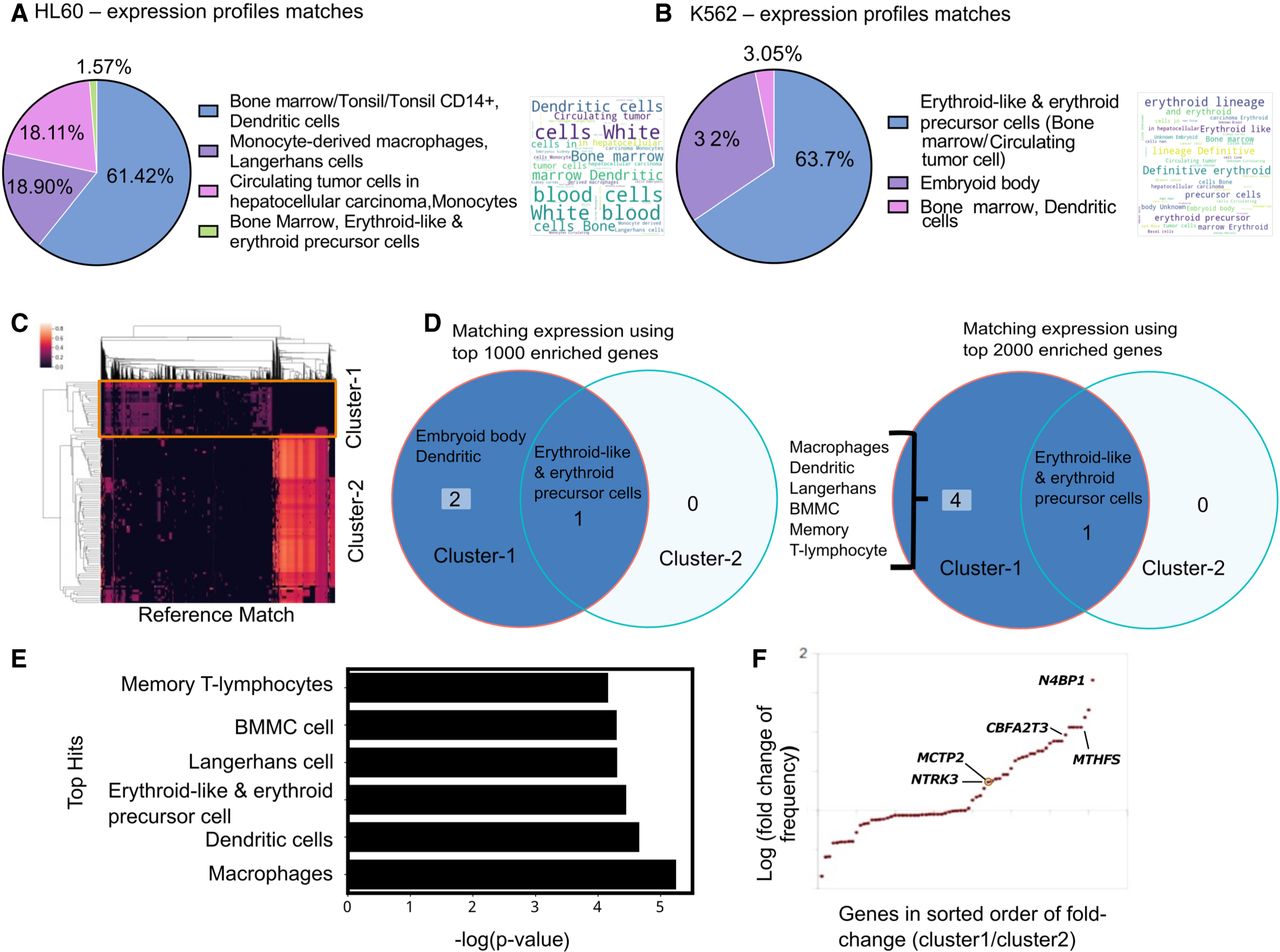
Case study of using scEpiSearch to reveal lineage and underlying multipotency of cancer cells. (A) The pie chart shows the proportion of cell types for the top five matching single-cell expression profiles for scATAC-seq read-count matrix for HL60 cells. A word-cloud of annotations of matching single-cell expression profiles is also shown on the right side of the pie chart. (B) The proportions of cell types for the top five matching single-cell expression profiles for scATAC-seq read-count matrix for K562 cells. The corresponding word-cloud is shown on the right. (C) Heatmap of match scores achieved with top matching reference epigenome profiles for scATAC-seq read-count matrices of K562 cells. Columns in the heatmap show matching epigenome profiles from reference, and every row represents a Query cell (K562 cell). Two clusters of query cells are also shown. (D) The annotations of cells for the top five match expression profiles matching to a scATAC-seq data set of K562 cells in cluster-1 and cluster-2. The result has been shown when top-1000 and top-2000 enriched genes are used. (E) Average P-values for matching (while using top 2000 enriched genes) to cluster-1 K562 cells with different cell types. (F) Fold change in frequency of being in the top 50 enriched genes is shown for query K562 cells from two clusters. Each dot represents a gene. It is plotted only for those genes which have a frequency of at least 10% in either class and have a fold change above 1.05. Genes whose names are displayed in the plot are known to be markers for dendritic lineage.


