
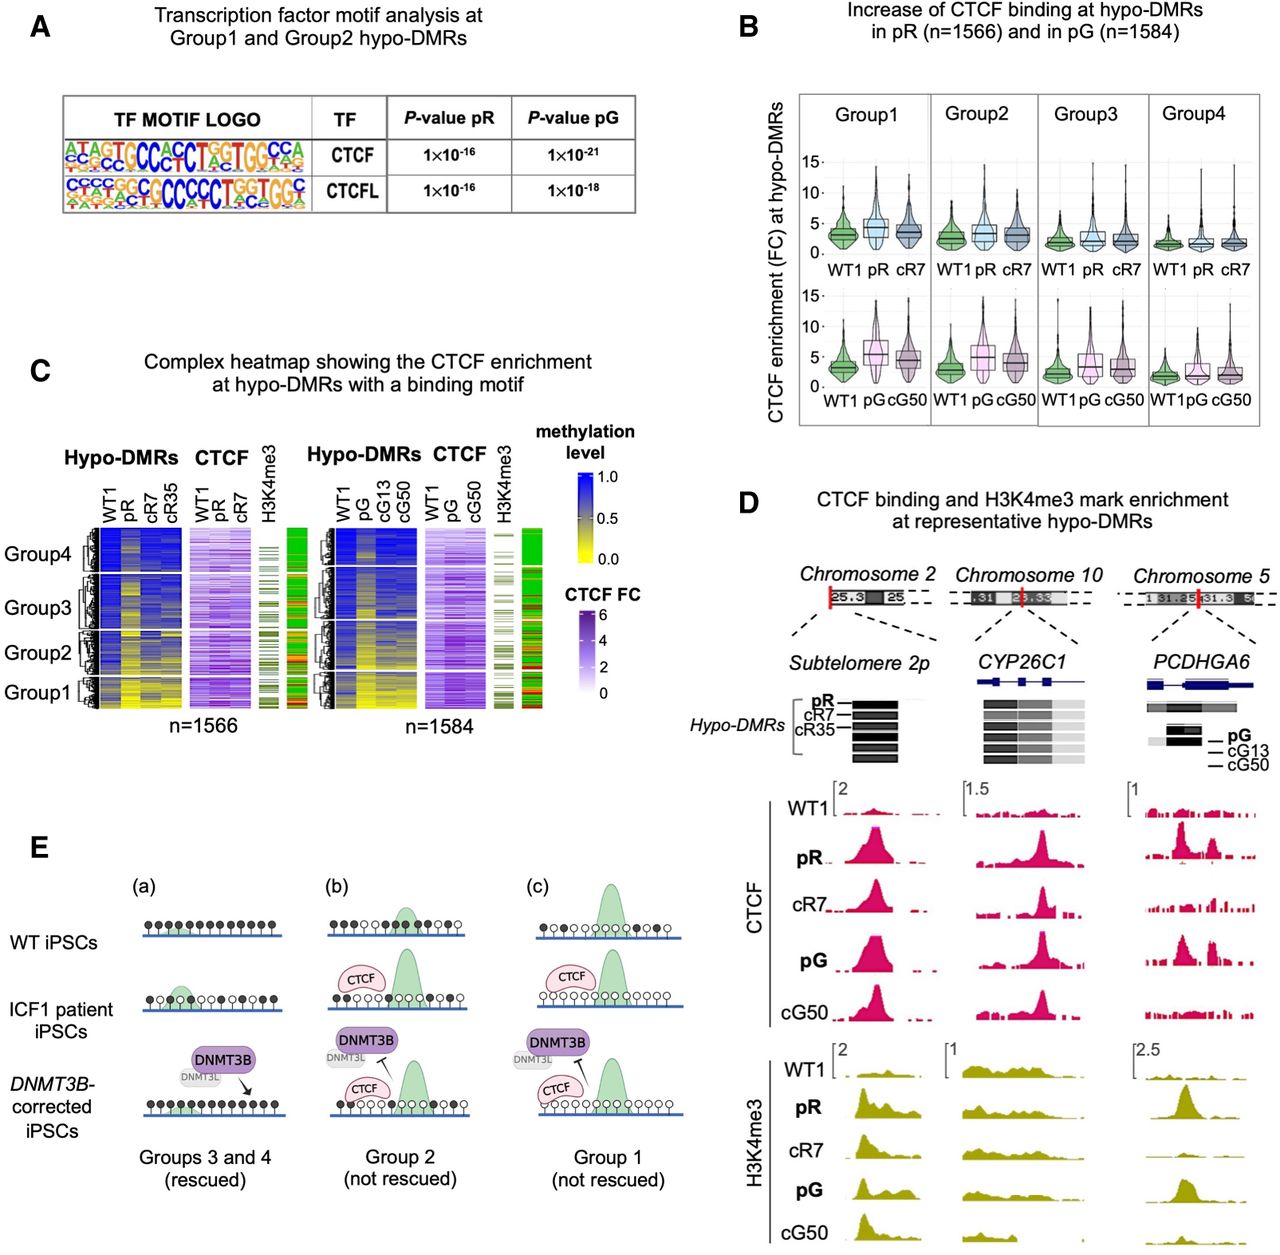
Abnormal CTCF binding at a small fraction of hypo-DMRs contributes to persisting hypomethylation. (A) Motif enrichment analysis of known TFs at hypo-DMRs with reduced DNMT3B binding and increased H3K4me3 levels. The panel corresponds to motifs enriched at the subset of hypo-DMRs corresponding to Groups 1 and 2 in pR (n = 1177) and pG (n = 1230) iPSCs, as shown in Figure 1B. (B) Violin and boxplot representation of CTCF enrichment (IP/input) calculated across hypo-DMRs with a CTCF HOMER motif in WT1, ICF1 iPSCs, and one of their corrected clones (cR7 for pR and cG50 for pG). To quantify the statistical significance of the increased CTCF enrichment in Groups 1 and 2 compared to Groups 3 and 4, we calculated the difference between ICF1(FC) – WT(FC) and corrected clone (FC) – WT1(FC) for each group and applied nonparametric paired Wilcoxon test with one-sided alternative and BH-FDR correction. We then computed the effect size between the differences (for pR, G1 = 0.38; G2 = 0.26; G3 = 0.14; G4 = 0.03; for pG, G1 = 0.63; G2 = 0.48; G3 = 0.35; G4 = 0.11). (C) A complex heatmap showing the integration of methylation level and CTCF ChIP-seq enrichment (FC) across pR and pG ICF1 hypo-DMRs containing CTCF binding motifs. The presence of H3K4me3 enriched peaks proximal to hypo-DMRs (within 1 kb) and the status of hypo-DMR correction is depicted on the right. The proportion of H3K4me3 enriched peaks out of the total number of hypo-DMRs in each group is higher in Group 1 (pR = 137 [40%]; pG = 145 [51%]) and Group 2 (pR = 140 [31%]; pG = 150 [50%]) compared to Group 3 (pR = 98 [20%]; pG = 85 [17%]) and Group 4 (pR = 46 [13%]; pG = 50 [12%]); one-sided Fisher's exact test: Group 1 versus Group 3 and versus Group 4 (P-adj < 0.0001), and Group 2 versus Group 3 (P-adj < 0.001) and Group 4 (P-adj < 0.0001). (D) Genome browser views of representative regions characterized by abnormal increase of CTCF binding, as observed by ChIP-seq in WT, ICF1, and corrected iPSCs (cR7 for pR and cG50 for pG). Green tracks represent H3K4me3 enrichment levels in iPSCs. (E) Graphical representation of hypo-DMRs identified in ICF1 iPSCs and clustered in Groups 1–4 based on their DNA hypomethylation level, as reported in Figure 4A: (a) Rescued hypo-DMRs of Groups 3 and 4, showing high methylation and low H3K4me3 levels (green peak) in WT iPSCs, mild hypomethylation and H3K4me3 increase in ICF1 iPSCs, and regain of normal DNA methylation and H3K4me3 levels upon restoration of DNMT3B activity by gene editing; (b) unrescued hypo-DMRs of Group 2, showing initial intermediate/high DNA methylation levels and H3K4me3-enrichment in WT iPSCs, severe hypomethylation, high H3K4me3 increase in ICF1 iPSCs and/or abnormal CTCF binding, which persist in the corrected clones; (c) unrescued hypo-DMRs of Group 1, showing initial low DNA methylation level and high H3K4me3-enrichment in WT iPSCs, severe hypomethylation, high H3K4me levels and/or abnormal CTCF binding in ICF1 iPSCs, which are resistant to correction as in Group 2.


