
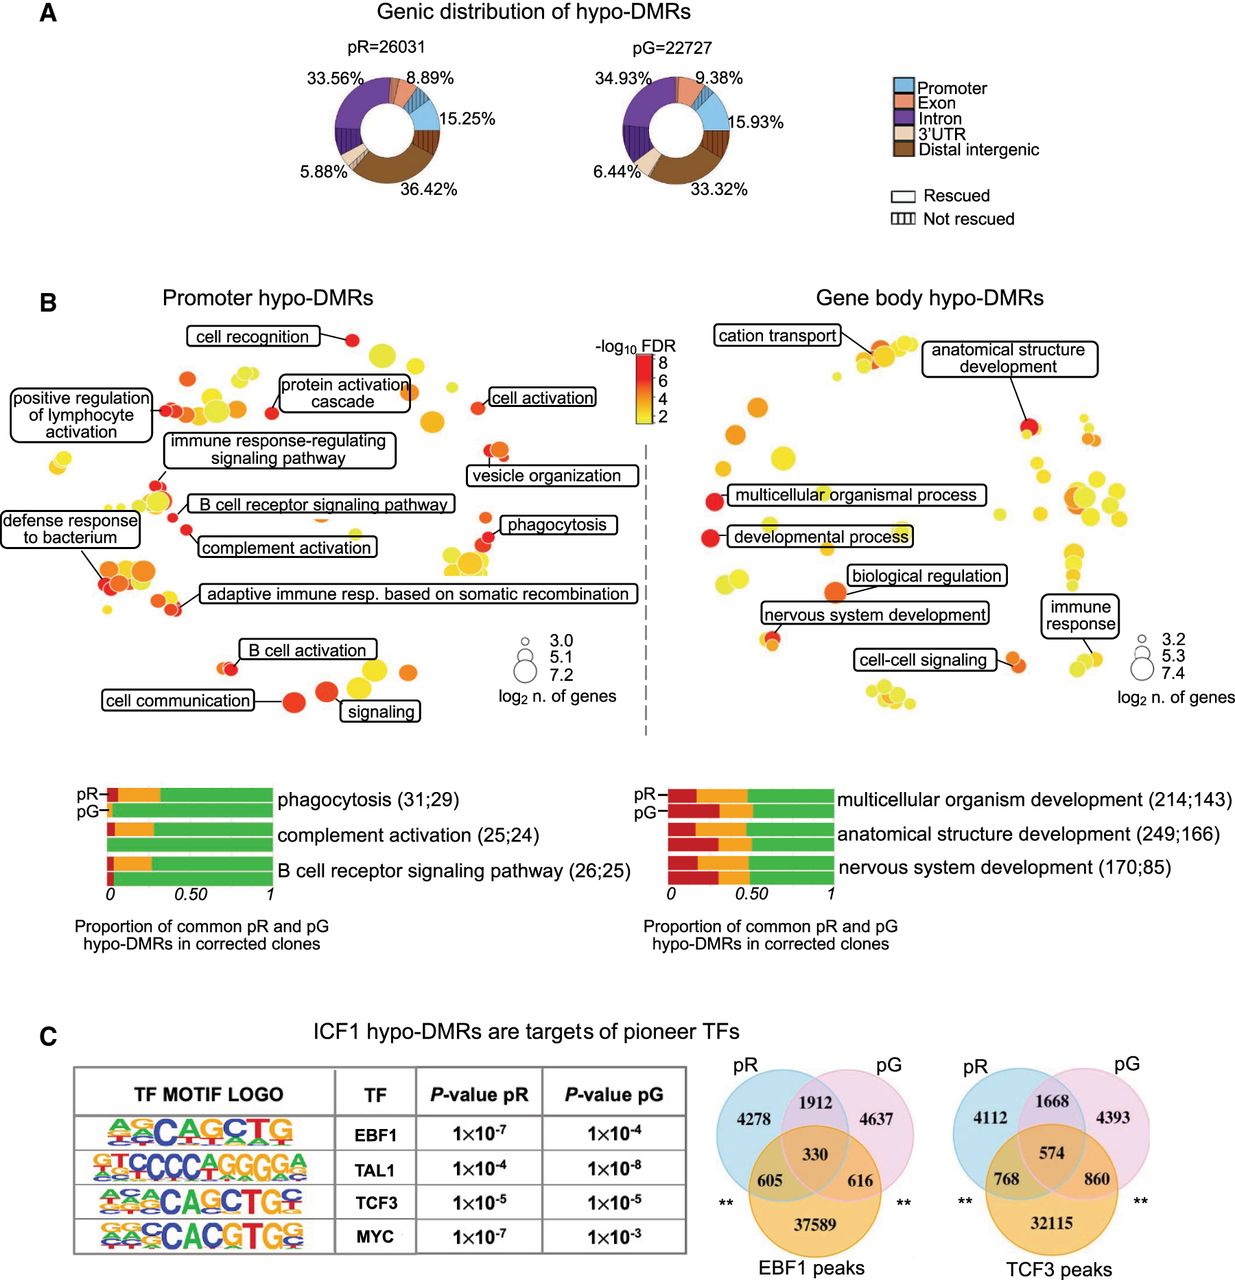
DNMT3B shapes CG methylation patterns at genes with functions in innate and adaptive immune responses. (A) Donut charts depicting the percentage distribution of hypo-DMRs in pR and pG, annotated to various genic regions. Striped areas: hypo-DMRs resistant to hypomethylation correction. (B, top) Gene Ontology biological processes terms (GO-BP) enriched for genes annotated to promoter (left) and intragenic (right) hypo-DMRs common to both ICF1 iPSCs (pR = 1328 and pG = 2336) are visualized as a multidimensional scaling scatter plots. The color scale represents the −log10 of the adjusted P-value (Benjamini–Hochberg with false discovery ratio correction < 0.01; BH-FDR) of the GO-BP term. The dot size represents the log2 of the number of hypo-DMR associated genes in each GO-BP term. (Bottom) Bar plots depicting the proportion of hypo-DMRs associated with genes enriched in the three most significant categories of GO-BP in promoter and gene-body that are fully (green), partially (orange), or not rescued (red) in corrected iPSCs clones (Supplemental Table S3). For each GO-BP, the upper and lower bars correspond to the hypo-DMRs status in pR and pG, respectively. The number of hypo-DMRs annotated to gene promoter or gene body is indicated in the brackets. (C, left) Motif enrichment analysis of known transcription factor (TF) at hypo-DMRs with reduced DNMT3B binding. The output displays the predicted motif sequence and the P-value significance for ranking the motif enrichment at pR and pG hypo-DMRs. (Right) Venn diagrams representing the overlap between ICF1 hypo-DMRs with enriched target regions of EBF1 and TCF3 TFs (peaks obtained from ENCODE ChIP-seq data sets of WT LCLs), P-adj < 0.001; shuffle test.


