
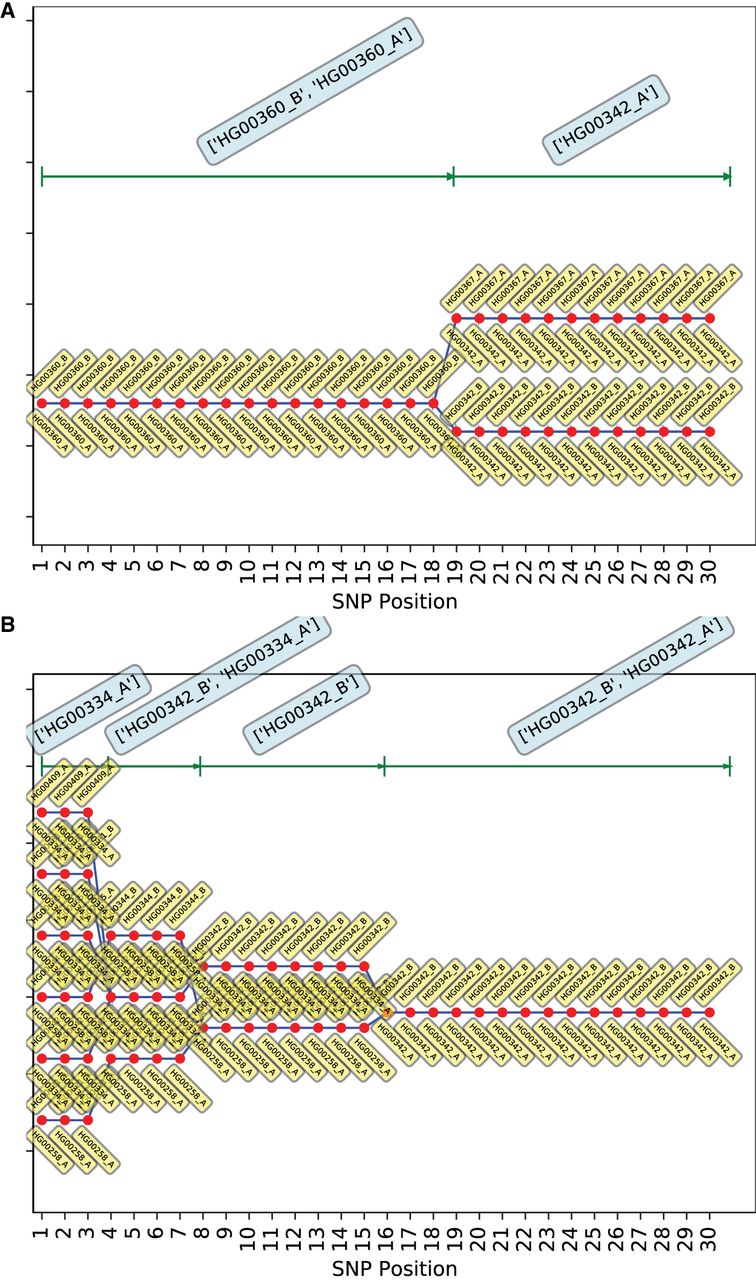
Figure 3.
Best-fit genotypic trajectories from PLIGHT_Exact for the diploid mosaic genome of HG00360 + HG00342 constructed across 30 SNPs each for Chromosomes 1 and 2. The composition of the best-fit pair of haplotypes at each locus is depicted by two yellow tags, one below and one above the red dots. (A) Trajectories for Chromosome 1. (B) Trajectories for Chromosome 2.


