
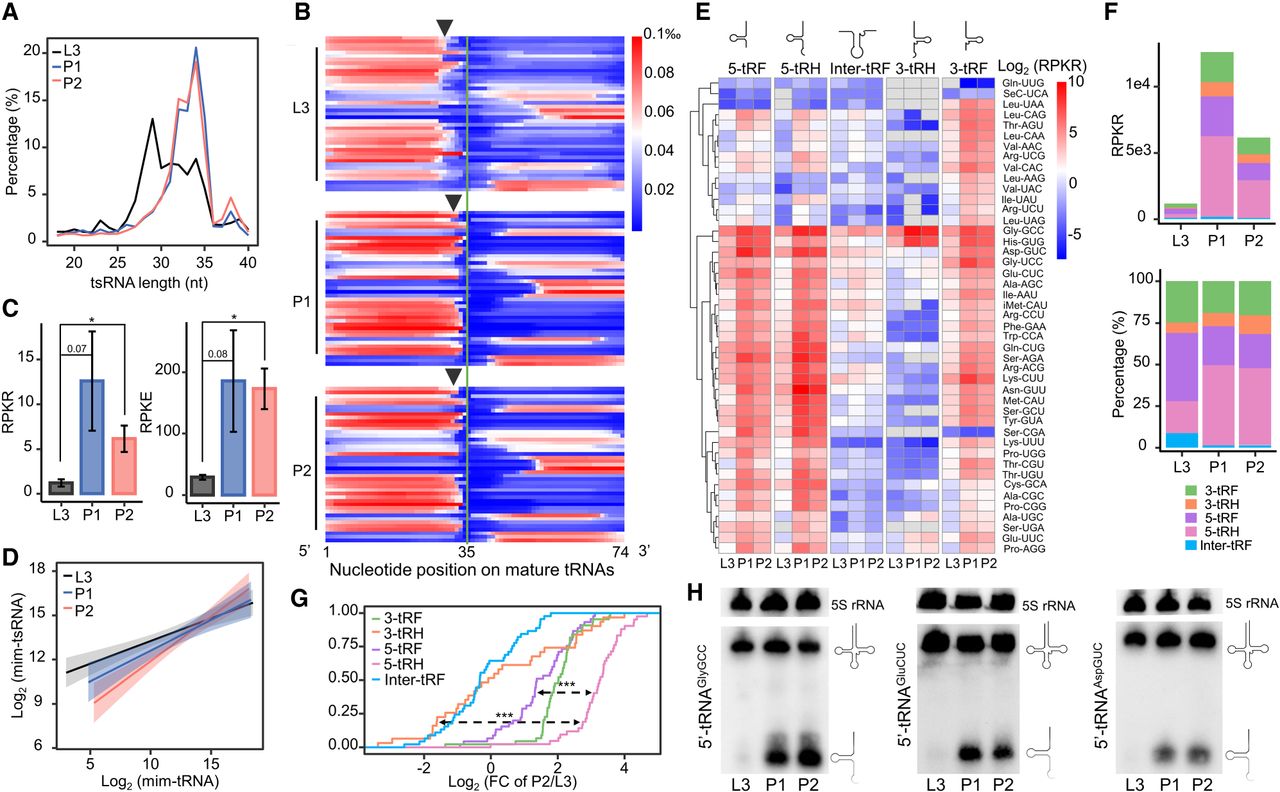
Expression level of 5′-tsRNAs increases during the larva-to-pupa transition. (A) The length distributions of mim-tsRNA-seq reads in L3 (black), P1 (blue), and P2 (red). (B) A heatmap showing the normalized coverage of mim-tsRNA-seq reads at each nucleotide position along each mature tRNA. Each line presents one tRNA isoacceptor and they are ranked alphabetically. Note that the 3′ ends of 5′ tsRNAs in L3 are generally trimmed by ∼2 nt more than those in P1 and P2 (arrows marking the average positions of the 3′ ends at each stage). (C) Quantifications of total tsRNAs in different developmental stages, performed using either 2S rRNA as an internal control (RPKR, reads per kilo 2S rRNA reads) or E. coli tRNALysUUU as a spike-in control (RPKE, reads per kilo E. coli tRNA reads). Error bars represent SEM (standard error of the mean) computed from two or three biological replicates. Asterisks indicate significant differences (Student's t-test P < 0.01 denoted as **). (D) Linear models of the relationships between tsRNA and tRNA abundances in L3 (black), P1 (blue), and P2 (red). The log-log slopes are 0.308, 0.416, and 0.604 for L3, P1, and P2, respectively. (E) A heatmap showing the tsRNA abundances (RPKR) in L3, P1, and P2 stages. The mim-tsRNA-seq reads mapped to all cytoplasmic tRNA genes were grouped into five subclasses: 5-tRF, 5-tRH, Inter-tRF, 3-tRH, and 3-tRF. (F) Absolute (top) and relative (bottom) quantifications of total tsRNAs in each of the five subclasses. 3-tRF (green), 3-tRH (orange), 5-tRF (purple), 5-tRH (pink), and Inter-tRF (blue). (G) Empirical cumulative distribution function (ECDF) of the dynamic changes (P2/L3) in tsRNA levels (measured as RPKR) of different subclasses. Kolmogorov–Smirnov tests against the differences between 5-tRH versus 5-tRF and 5-tRH versus 3-tRH P < 0.001 (***). (H) Northern blots using probes against the 5′ ends of tRNAAspGUC, tRNAGlyGCC, and tRNAGluCUC. Each experiment has two independent replicates with consistent results.


