
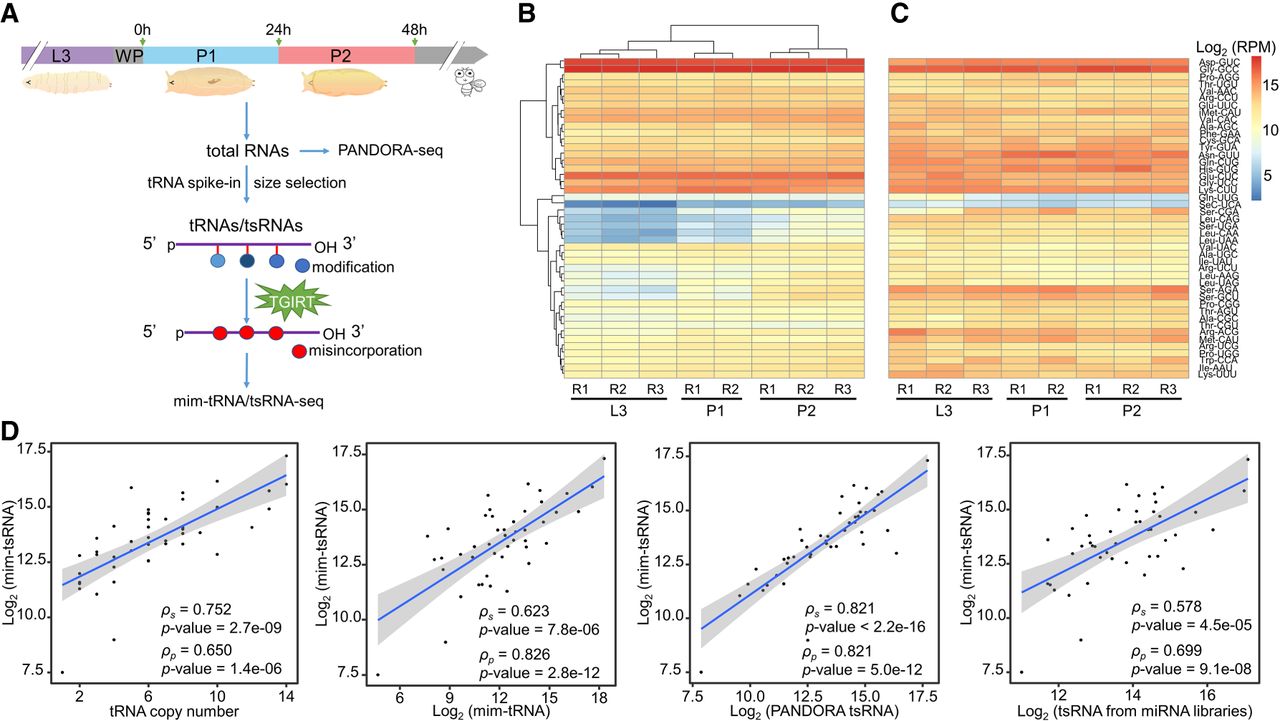
Quantitative profiling of tRNA and tsRNA abundances during the larva-to-pupa transition of D. melanogaster. (A) Experimental design to co-profile tRNAs and tsRNAs in third-instar larvae (L3), first and second day pupae (P1 and P2). (B,C) Heatmaps showing the abundances (RPM, reads per million mapped reads) of tRNAs and tsRNAs from whole-body extracts of the examined developmental stages, respectively. Hierarchical clustering was performed on tRNA-seq libraries across different biological samples and across different tRNA genes (grouped according to the unique anticodons). (D) Scatterplots show that at the same or close stage, tsRNA abundances were correlated with tRNA gene copy numbers, tRNA abundances, tsRNA abundances measured by PANDORA-seq, and tsRNA abundances measured by miRNA-seq (SRP048223 and SRP000602), respectively. Solid lines: linear regression models; shades: 95% confidence interval (CI). Pearson's correlation and Spearman's correlation were labeled as ρp and ρs, respectively.


