
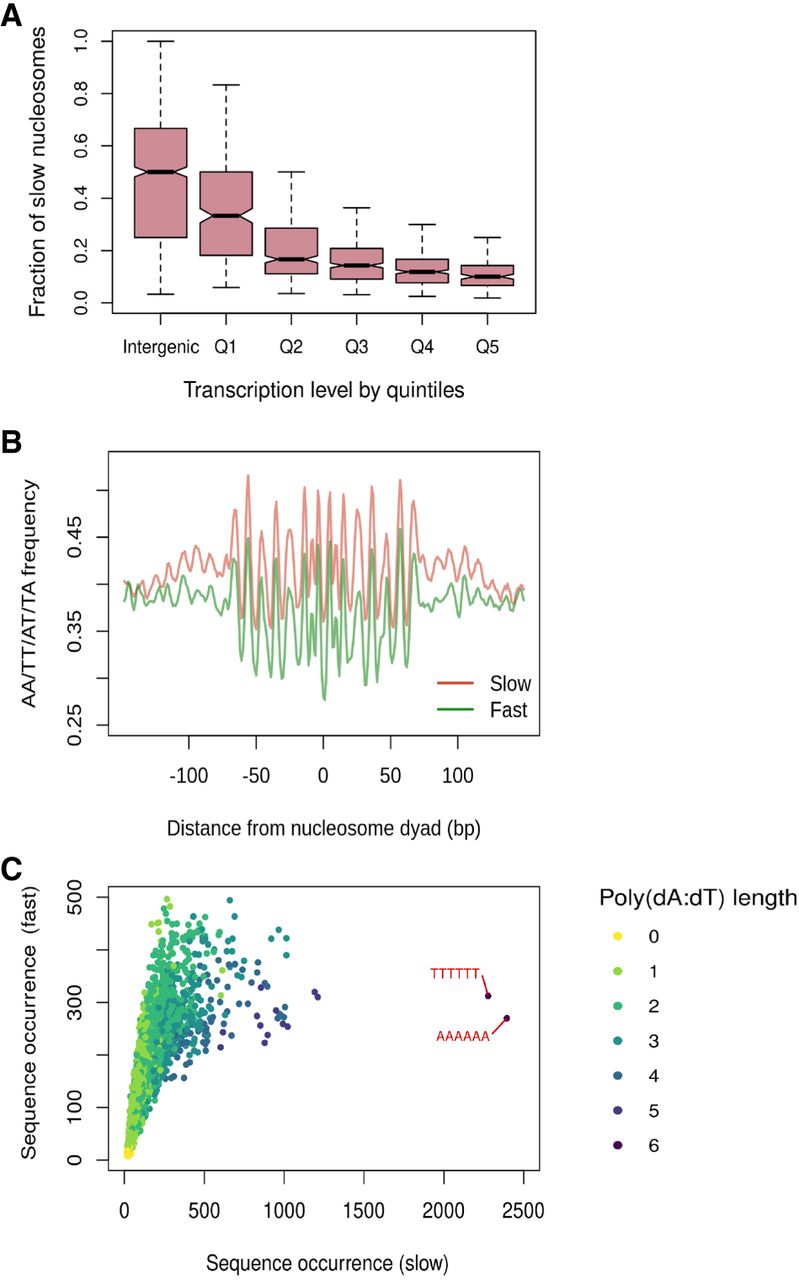
Genomic and sequence features associated with slow-to-mature nucleosomes. (A) Fraction of slow nucleosomes identified in cac1Δ cells among all nucleosomes in the intergenic regions and gene bodies. Genes are binned into quintiles based on expression levels (Churchman and Weissman 2011). Q1 represents genes with the lowest expression level, and Q5 represents genes with the highest expression level. (B) Aggregated position-dependent A/T dinucleotide frequencies surrounding the dyads of fast and slow nucleosomes. (C) Scatterplot depicting the occurrence of all possible 6-mer sequences from the DNA associated with fast and slow nucleosomes. Dots are colored by the length of the longest poly(dA:dT) sequence that exists in the sequence.


