
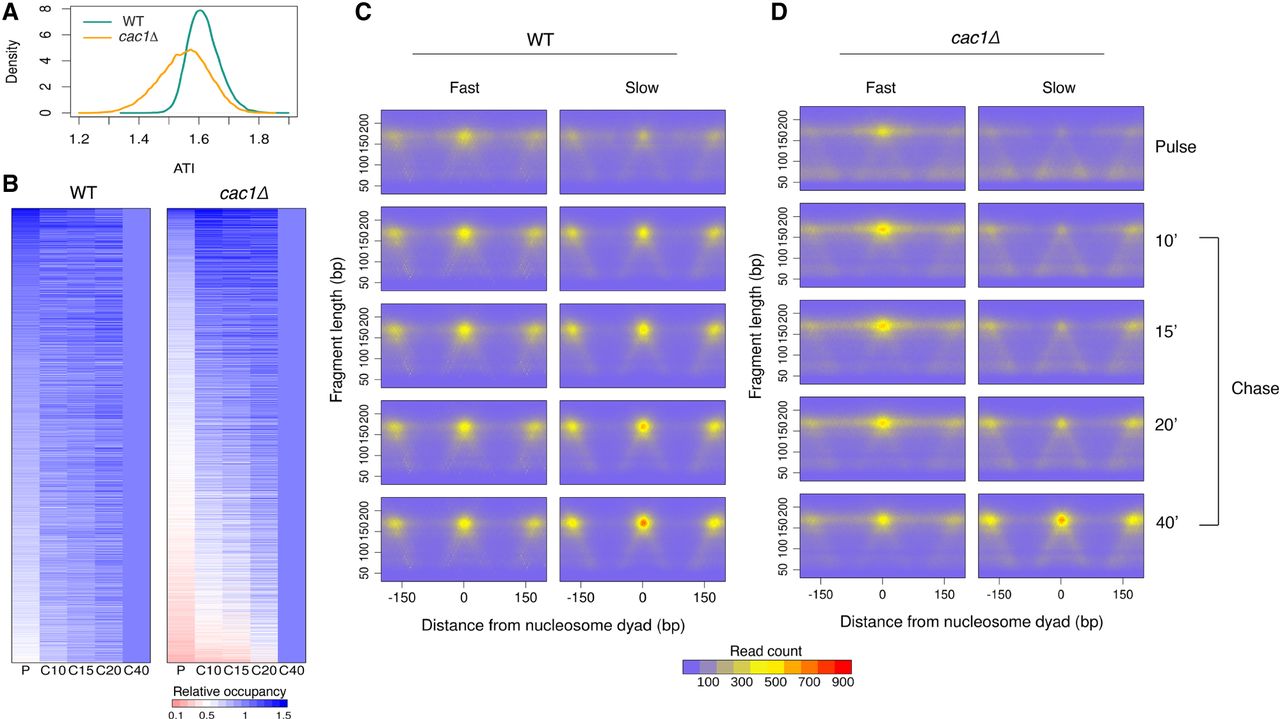
Figure 2.
cac1Δ cells show a heterogeneous rate of histone octamer assembly behind the fork. (A) Density distributions of ATI values for all high-confidence nucleosomes in WT and cac1Δ cells. (B) Heat maps of nucleosome occupancy at each time point relative to the final time point for the 5344 high-confidence nucleosomes on Chr IV. Each row represents an individual nucleosome. Heat maps are ordered independently by decreasing ATI values. (C,D) Aggregated chromatin profiles at all time points for the fast and slow nucleosomes identified in WT (C) and cac1Δ (D) cells.


