
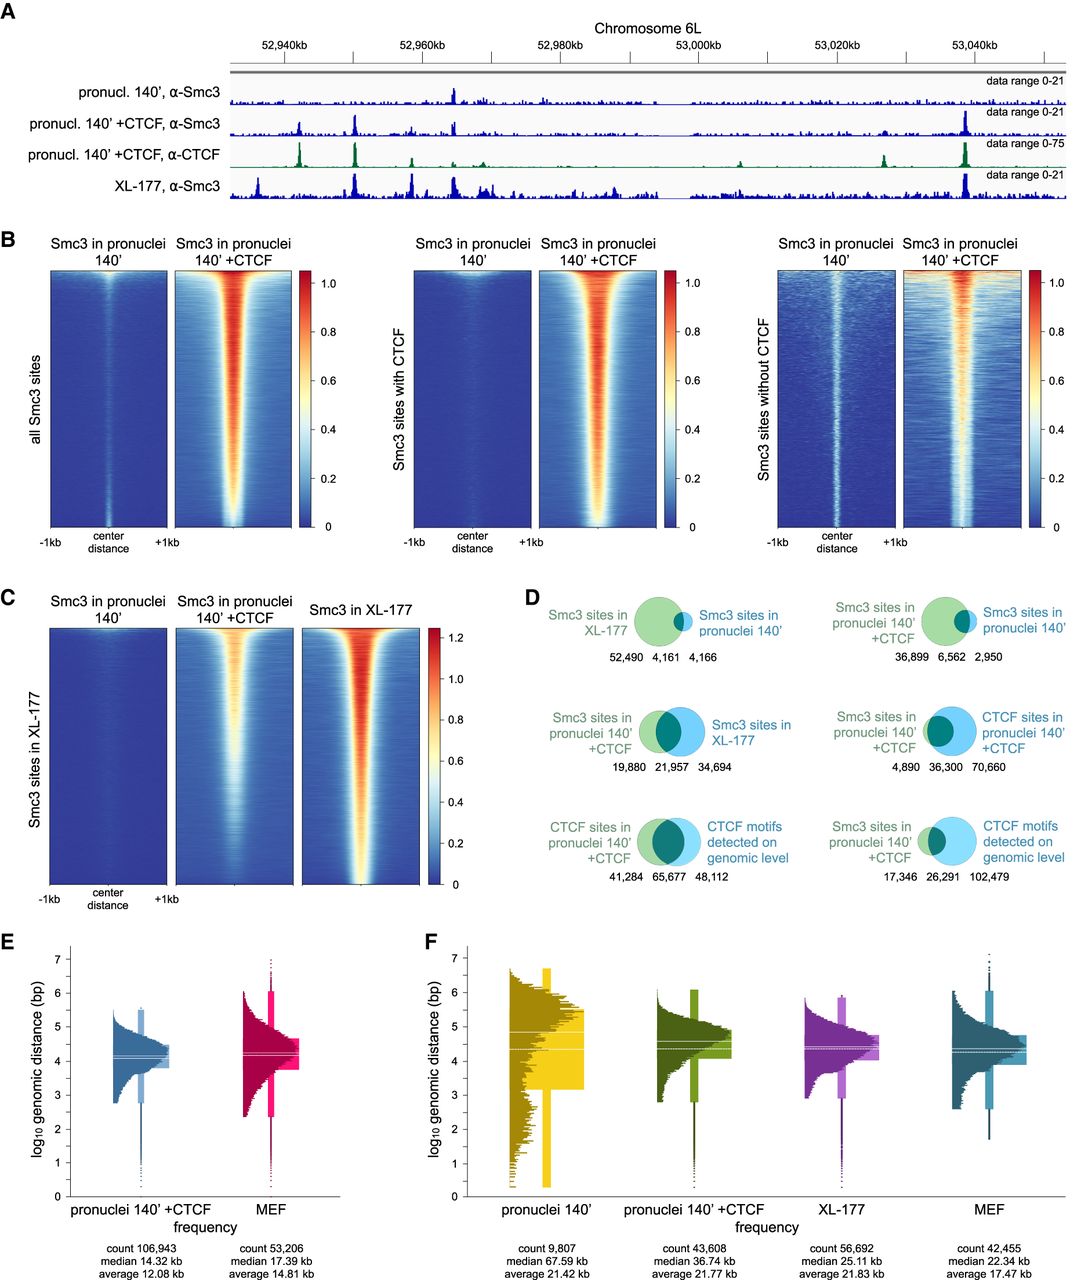
Addition of recombinant CTCF to Xenopus pronuclei repositions cohesin. (A) Anti-Smc3 and anti-CTCF ChIP-seq tracks of demembranated frog sperm in Xenopus egg extract after 140 min (pronuclei 140′), pronuclei 140′ with addition of 50 nM CTCF protein, and frog XL-177 cells in the region of Chr6L:52.94–53.05 Mb. Pronuclei 140′ and pronuclei 140′ +CTCF data sets were obtained in a calibrated ChIP-seq experiment. (B) For pronuclei 140′ and pronuclei 140′ with addition of 50 nM CTCF protein, heat maps showing Smc3 enrichment over all Smc3 binding sites detectable in any of the two data sets, binding sites with Smc3-CTCF colocalization, and Smc3 binding sites that do not colocalize with CTCF, sorted by strength. (C) For pronuclei 140′, pronuclei 140′ with addition of 50 nM CTCF protein, and XL-177 cells, heat maps showing Smc3 enrichment over Smc3 binding sites in XL-177 cells, sorted by strength. (D) Venn diagrams showing the overlap of called Smc3 or CTCF binding sites for the same samples as in A, as well as CTCF binding motifs detected algorithmically on a genomic level, with numbers of shared and nonshared sites indicated below each Venn diagram. (E) Distribution of genomic distances between neighboring CTCF binding sites for pronuclei 140′ with addition of 50 nM CTCF protein compared with mouse MEF cells by Busslinger et al. (2017), shown using box plots with the internal distribution overlaid. Genomic distances are scaled with log10. Continuous white lines represent medians; dashed white lines represent averages. (F) Distribution of genomic distances between neighboring Smc3 binding sites for pronuclei 140′, pronuclei 140′ with addition of 50 nM CTCF protein, XL-177 cells, and mouse MEF cells, shown using box plots with the internal distribution overlaid. Genomic distances are scaled with log10. Continuous white lines represent medians; dashed white lines represent averages.


