
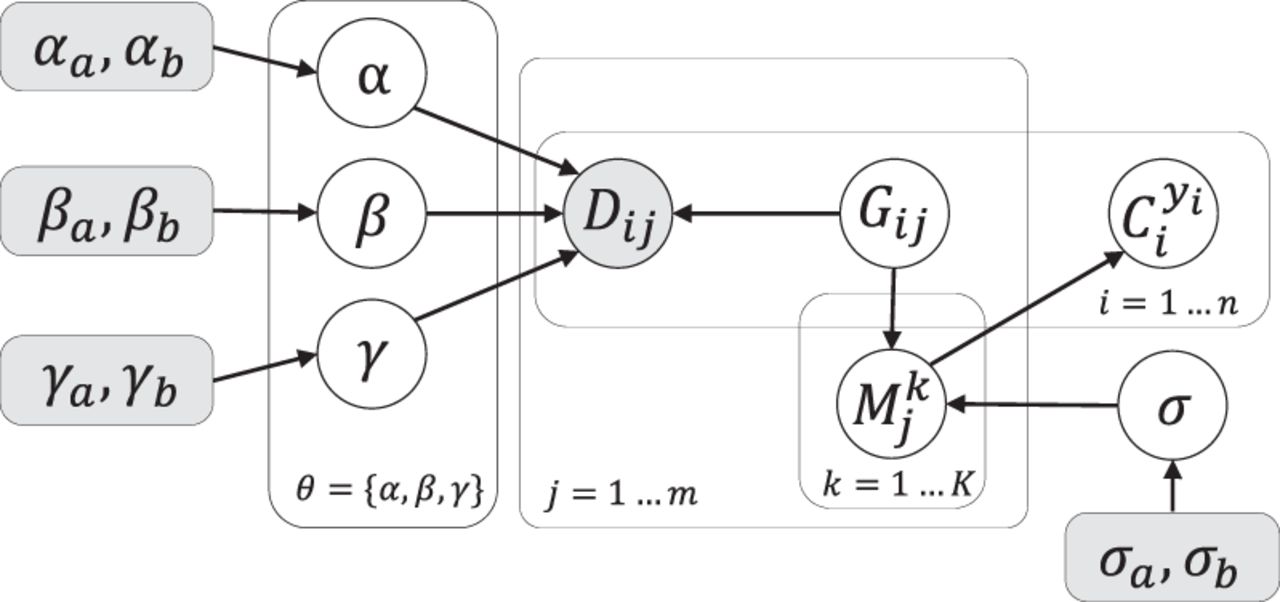
Figure 7.
Probabilistic graphic model of SCsnvcna. Shaded nodes are given parameters or input data. Unshaded nodes are the latent variables to be inferred.
(Downloading may take up to 30 seconds. If the slide opens in your browser, select File -> Save As to save it.)
Click on image to view larger version.
Probabilistic graphic model of SCsnvcna. Shaded nodes are given parameters or input data. Unshaded nodes are the latent variables to be inferred.
 CiteULike
 Delicious
 Digg
Digg Facebook
 Google+
 Reddit
 Twitter
