
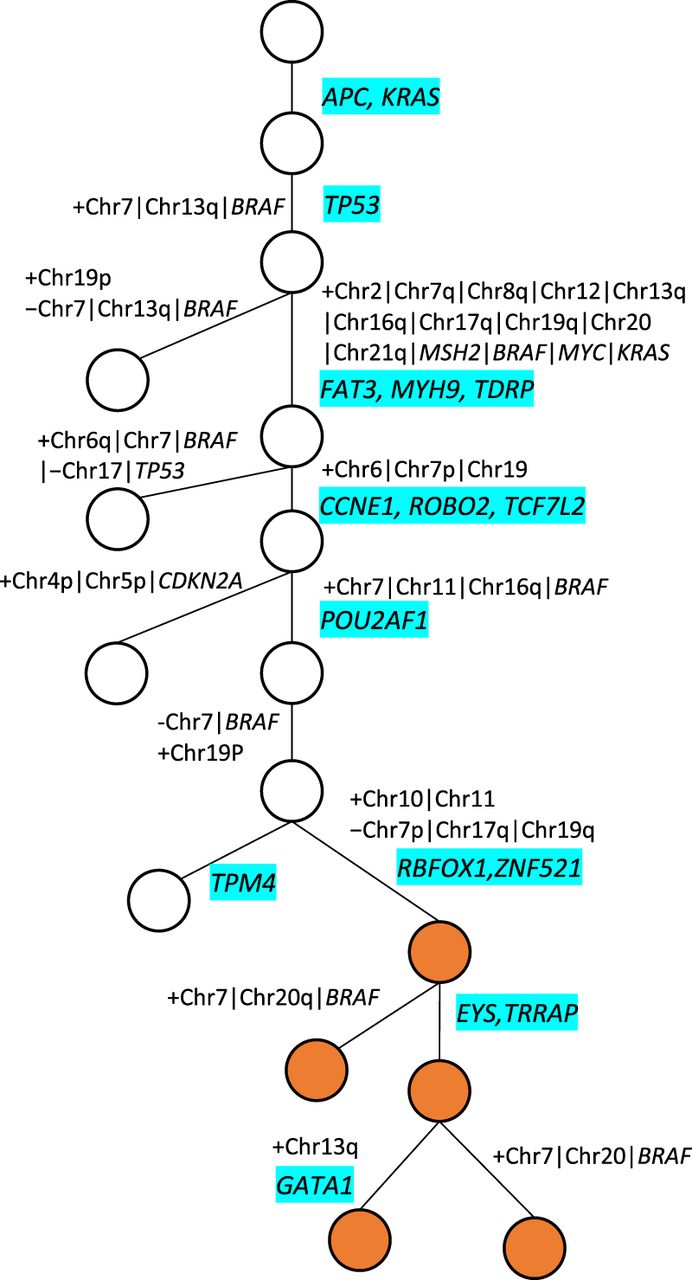
Figure 6.
A simplified phylogenetic tree for CRC1 inferred by SCsnvcna. Circles represent the tumor clones. Metastatic cells are highlighted in orange, whereas all other nodes represent cells in the primary tumor. The genes of CNAs and SNVs are annotated on the edges of the tree. SNVs are highlighted with the blue background. CNAs are in the white background. Copy number gains and losses are grouped in each line and are denoted by a leading “+” and “−” sign, respectively.


