
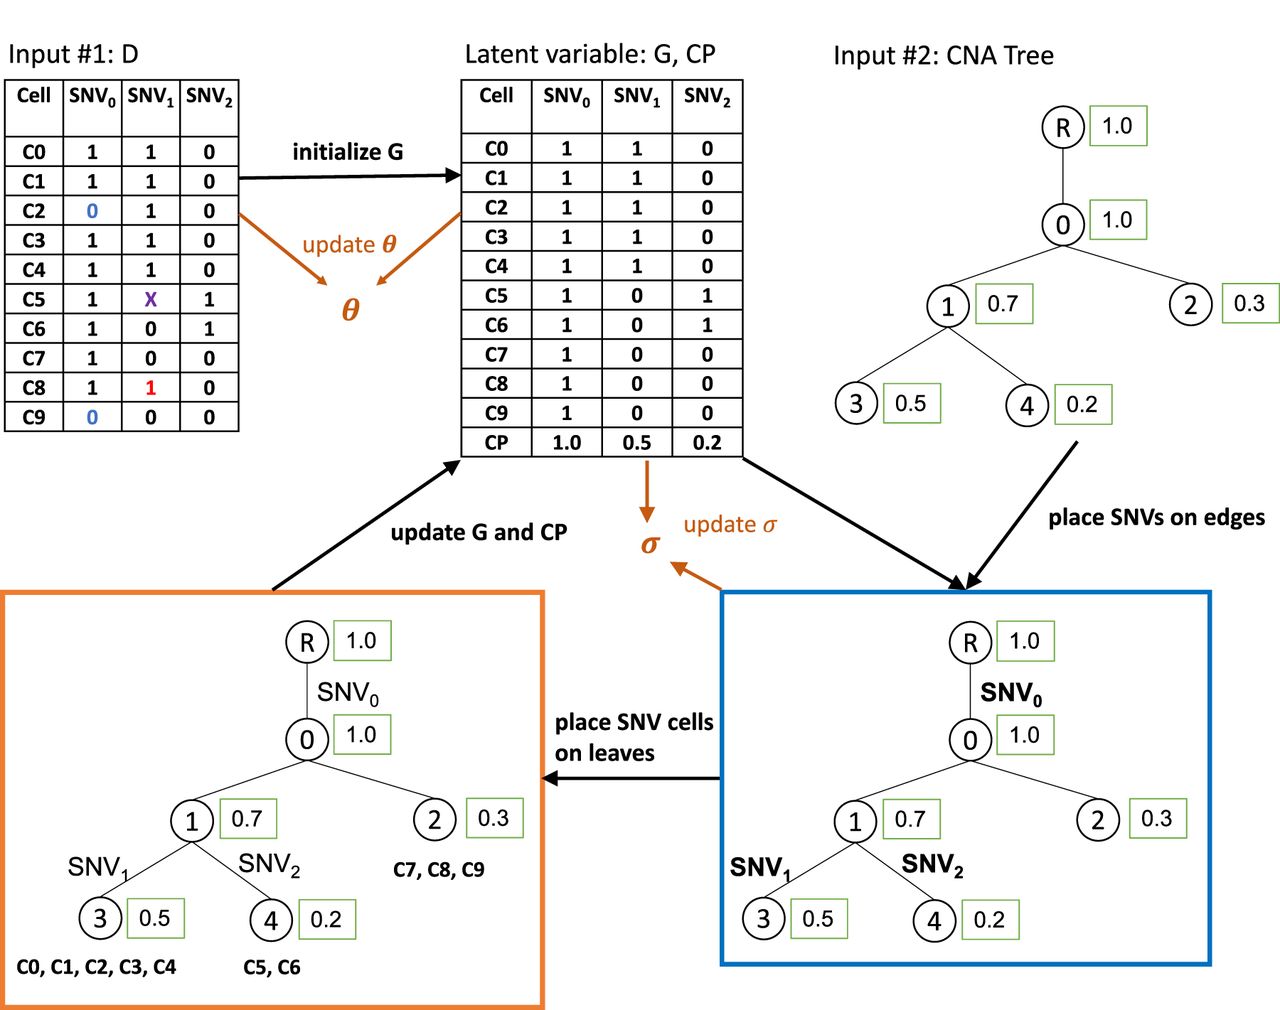
Figure 1.
Illustration of SCsnvcna method. Inputs are observed data D (a cell-by-SNV matrix) and a CNA tree. Observed data may have FP SNVs (red 1s), FN SNVs (blue 0s), and missing entries (X). The underlying genotype matrix G along with the CP is initialized based on D. SCsnvcna places SNVs on the edges of the CNA tree (blue box) and SNV cells on the leaves of the CNA tree (orange box), followed by the update of the latent variables, which are G, the error rates θ, and the standard deviation of the CP difference between CNA cells and SNV cells (σ). The output of SCsnvcna is the placement of SNVs and cells on the CNA tree and the predicted values of G, θ, and σ.


