
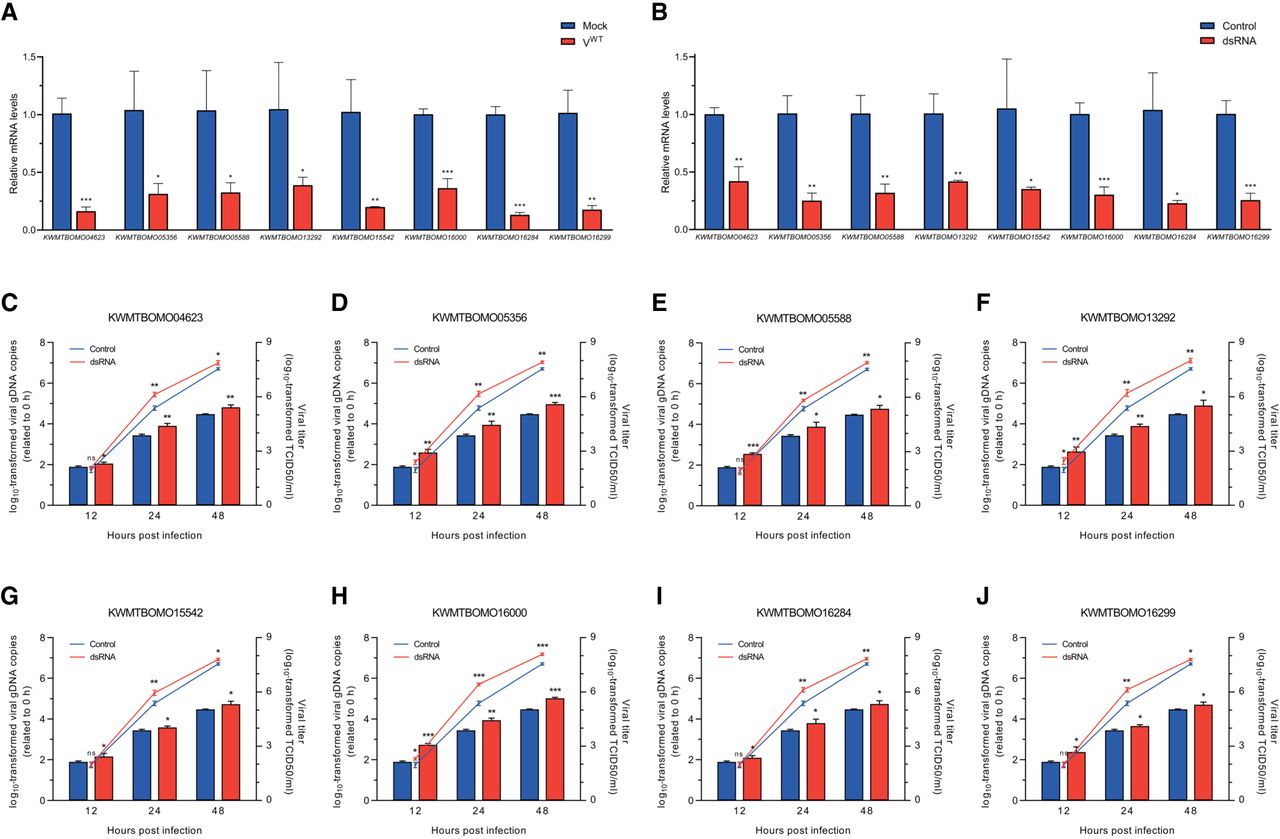
Obstruction of the transcriptional activation of antiviral genes facilitates viral infection. (A) qRT-PCR analysis for changes in the expression of antiviral genes at 48 h p.i. Rpl32 was used as the reference gene for data normalization. Three technical replicates for each of the three biological replicates per treatment were analyzed (n = 3). Error bar indicates the SD. Two-tailed t-test: (*) P < 0.05, (**) P < 0.01, (***) P < 0.001 versus mock. (B) qRT-PCR confirmed the decline of antiviral gene expression in BmN cells treated with corresponding dsRNAs at 48 h post transfection relative to the dsCtr-transfected control group. Rpl32 was used as the reference gene for data normalization. Three technical replicates for each of the three biological replicates per treatment were analyzed (n = 3). Error bar indicates the SD. Two-tailed t-test: (*) P < 0.05, (**) P < 0.01, (***) P < 0.001 versus the control. (C–J) Viral growth curves determined by TCID50 endpoint dilution assays and replication kinetics determined by qRT-PCR analysis in cells treated with corresponding dsRNAs of the indicated antiviral gene (log-transformed data). Viral gDNA copies were determined by quantification of the DNA copies of viral gene gp41, which were normalized to rpl27 and presented relative to the data at the 0-h p.i. time point. Three technical replicates for each of the three biological replicates per treatment were analyzed for viral gDNA measurements (n = 3), and three biological replicates per treatment were analyzed for titer determination (n = 3). Error bar indicates the SD. Two-tailed t-test: (*) P < 0.05, (**) P < 0.01, (***) P < 0.001 versus the control.


