
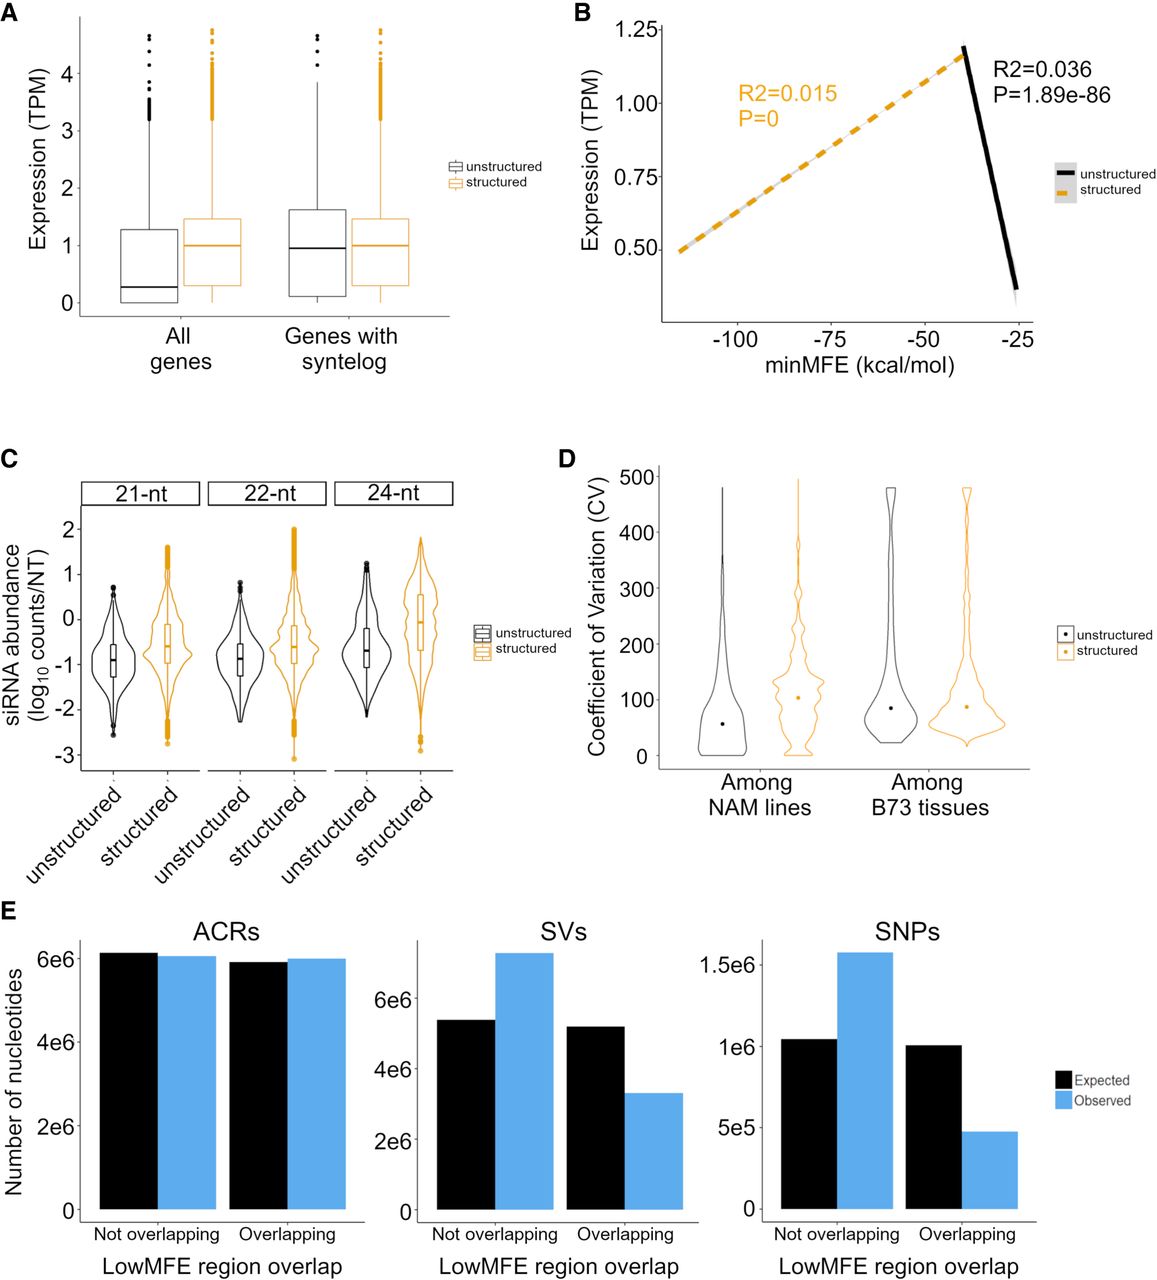
Expression differences between structured and unstructured genes, as defined by RNAfold analysis, in B73. The expression data are based on combined data across 23 tissues. (A) Difference in the overall magnitude of expression in all structured (n = 27,034) versus unstructured (n = 5054) genes and in structured versus unstructured genes with a syntelog in S. bicolor. The box plots report the range of the middle quartiles; whiskers report the range; and lines represent the median. (B) Expression as a function of minMFE for structured (dashed line) and unstructured genes with a S. bicolor syntelog (solid line). Both lines report the linear regression; both slopes are highly significant, as indicated by P-values on the figure. (C) The coefficient of variation (CV) of gene expression across the 26 NAM parents compared between structured and unstructured genes with a S. bicolor syntelog. The two categories differ significantly (P < 2.22 × 10⁻¹⁶). The graph also reports CV among B73 tissues, which does not differ significantly between structured and unstructured genes (P = 0.32). (D) smRNA mapping to structured and unstructured genes and for three smRNA lengths. For all three lengths, the difference is significant (P < 2.22 × 10⁻¹⁶). The violin plots show the distributions of smRNA counts, and the boxplots are formatted the same as in A. (E) Epigenetic and genetic features in lowMFE regions of genes. The plots show the number of expected and observed features overlapping (or not overlapping) the lowMFE region. For example, the number of ACRs (left graph) overlapping lowMFE regions is very similar to the number expected, based on the distributions along genes. In contrast, the numbers of observed SVs (middle) and SNPs (right) are highly underrepresented in lowMFE regions.


