
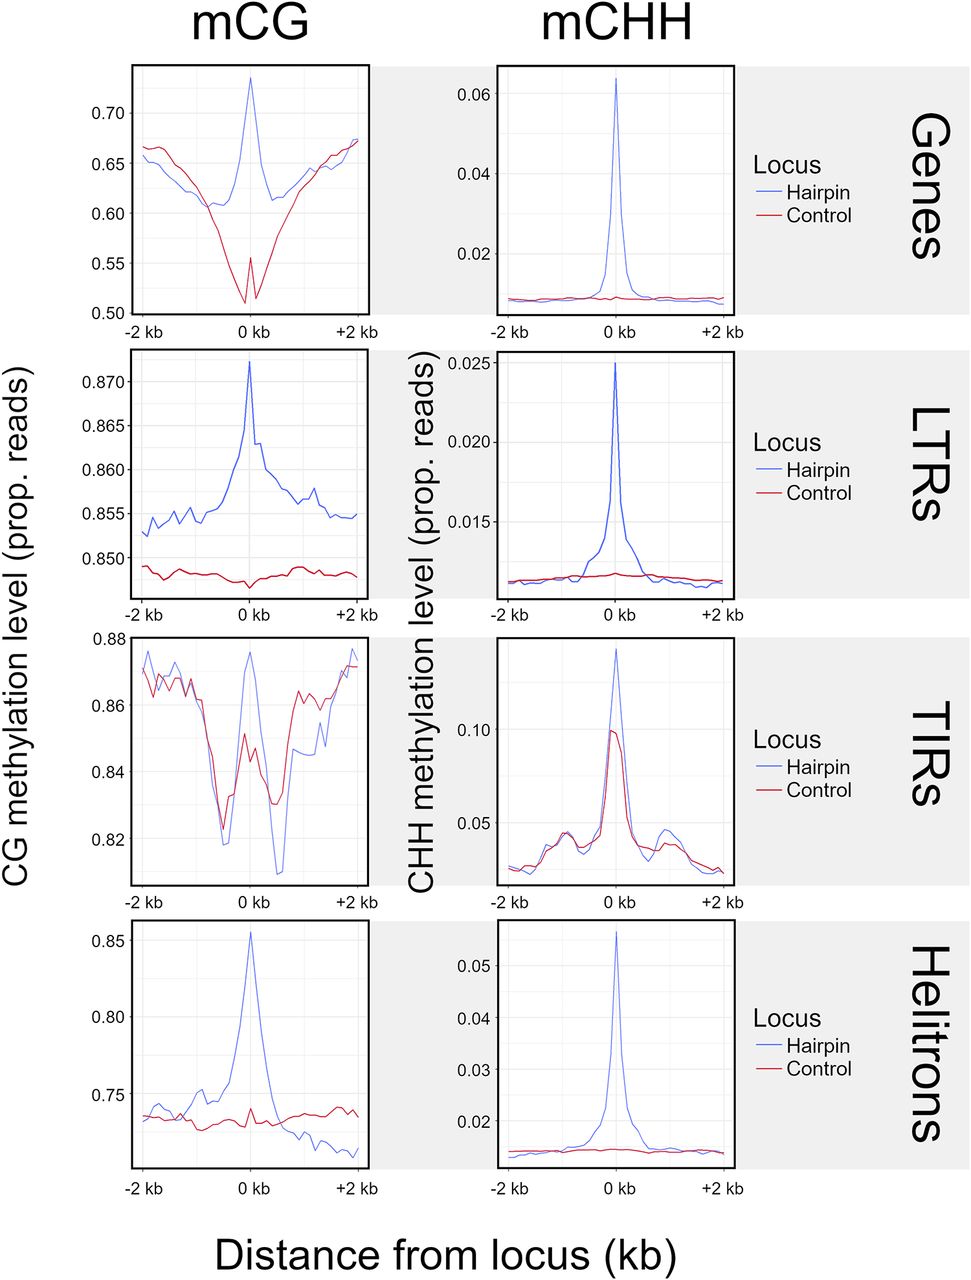
Methylation at LP-hairpins. The left column shows methylation in the CG context (mCG), and the right column shows methylation in the CHH context (mCHH). Each row represents a different feature type. The blue lines summarize the patterns of methylation in the hairpin (variable sizes, median = 25 nt) across all hairpins in a given feature type (e.g., all TIR hairpins, gene hairpins, etc.) and their flanking regions, divided into 40 nonoverlapping 100-bp windows. We assigned a control window to each hairpin in the data set by choosing a random window of the same size as the hairpin within the same element. The red line corresponds to methylation patterns around these randomized control loci.


