
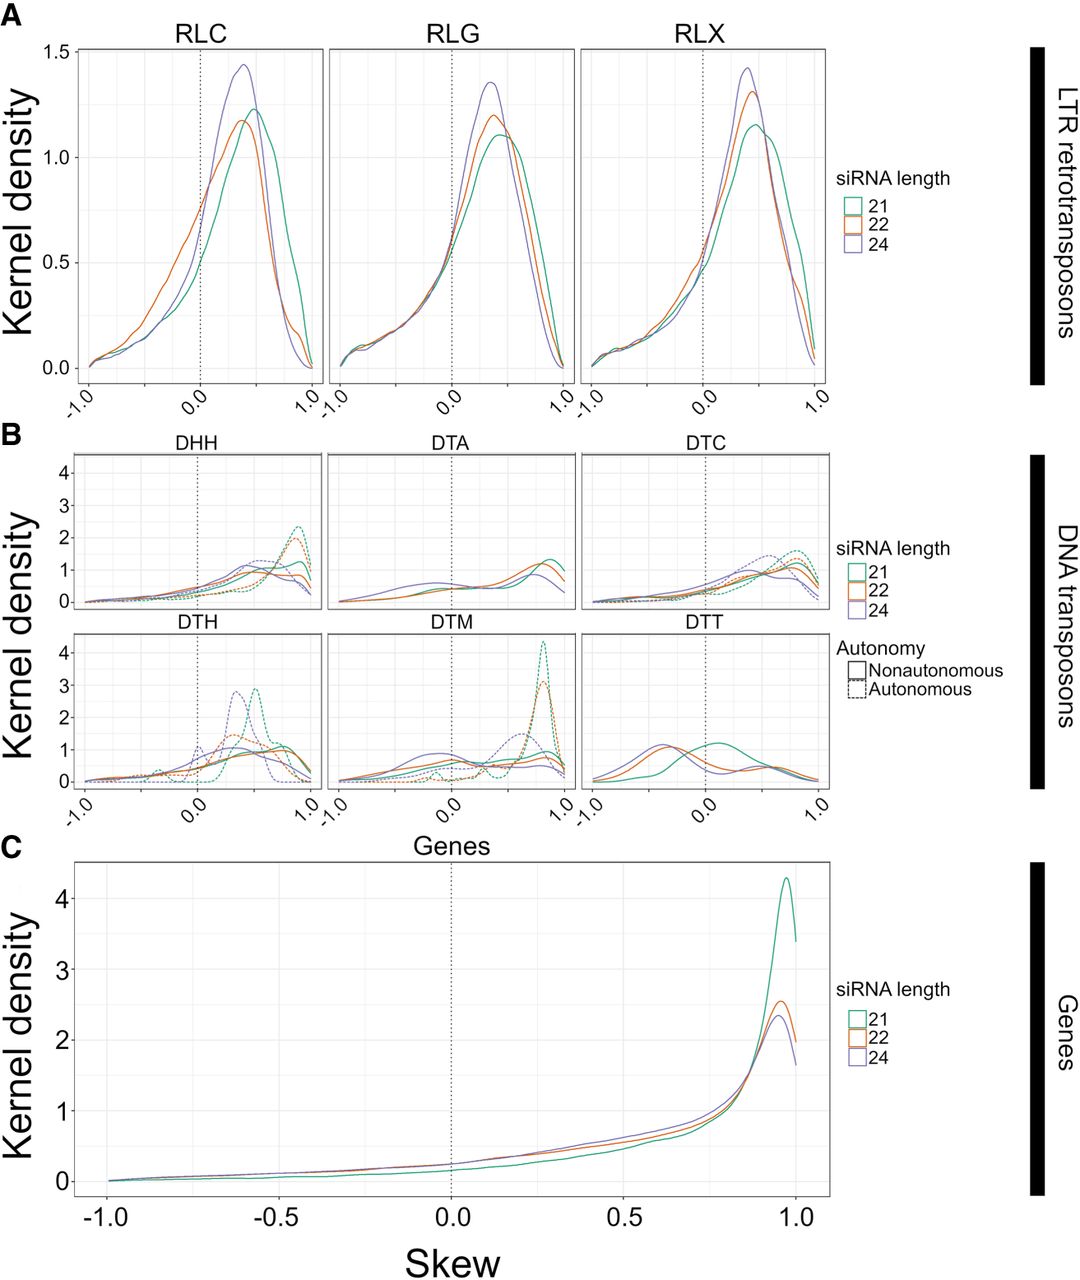
The distribution of skew for smRNA mapping in different feature categories. Skew is presented on the x-axis. Height on the y-axis represents the Gaussian-estimated kernel density of skew values. Skew measures the relative enrichments of smRNAs in miRNA-like regions compared with non-miRNA regions and ranges from 1.0 (enrichment in miRNA-like regions) to −1.0 (enrichment in non-miRNA-like regions). All panels use the same x-axis. The dotted vertical line represents zero, where smRNA density is not skewed to either low- or highMFE regions. (A) Skew for retrotransposons for 21-, 22-, and 24-nt smRNAs, separately for Copia (RLC), Ty3 (RLG), and unknown retrotransposons (RLX). (B) Skew for DNA transposons, with names for the three letter codes provided in Table 2. The dashed lines represent skew for putatively autonomous elements, and solid lines represent nonautonomous elements. (C) Skew measured in genes. These graphs are based on LP-hairpins but are analogous for lowMFE regions, and all feature categories are presented in Supplemental Figure S7.


