
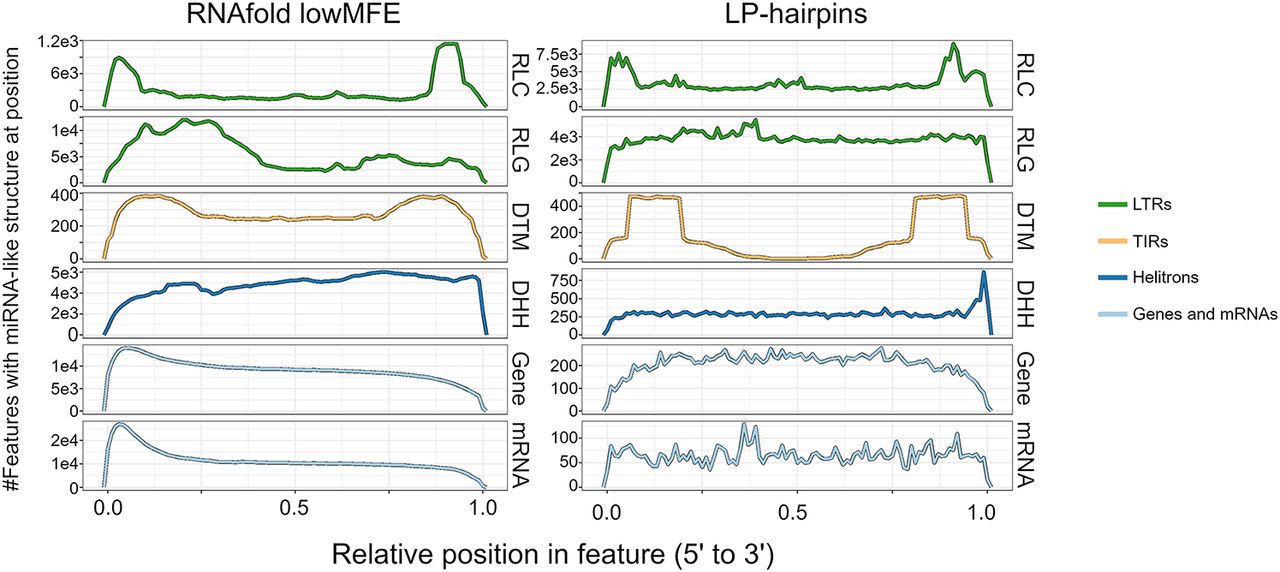
Landscapes of miRNA-like regions across feature types. Each row represents a metaprofile that combines data from all members of each feature type, based on structured members. Features were divided into 100 equally sized bins from the 5′ end to the 3′ end. The left column shows the number of features with lowMFE (<−40 kcal/mol) windows, and the right column shows the number of features with LP hairpins. A peak in the landscape represents a region that commonly contains miRNA-like structures. All panels share the same x-axis, which is represented proportionally across the length of features, from 0.00 (5′ end) to 1.00 (3′ end). This figure shows these locations for a subset of the 15 categories in Table 2; the remainder of the categories are shown in Supplemental Figure S4.


