
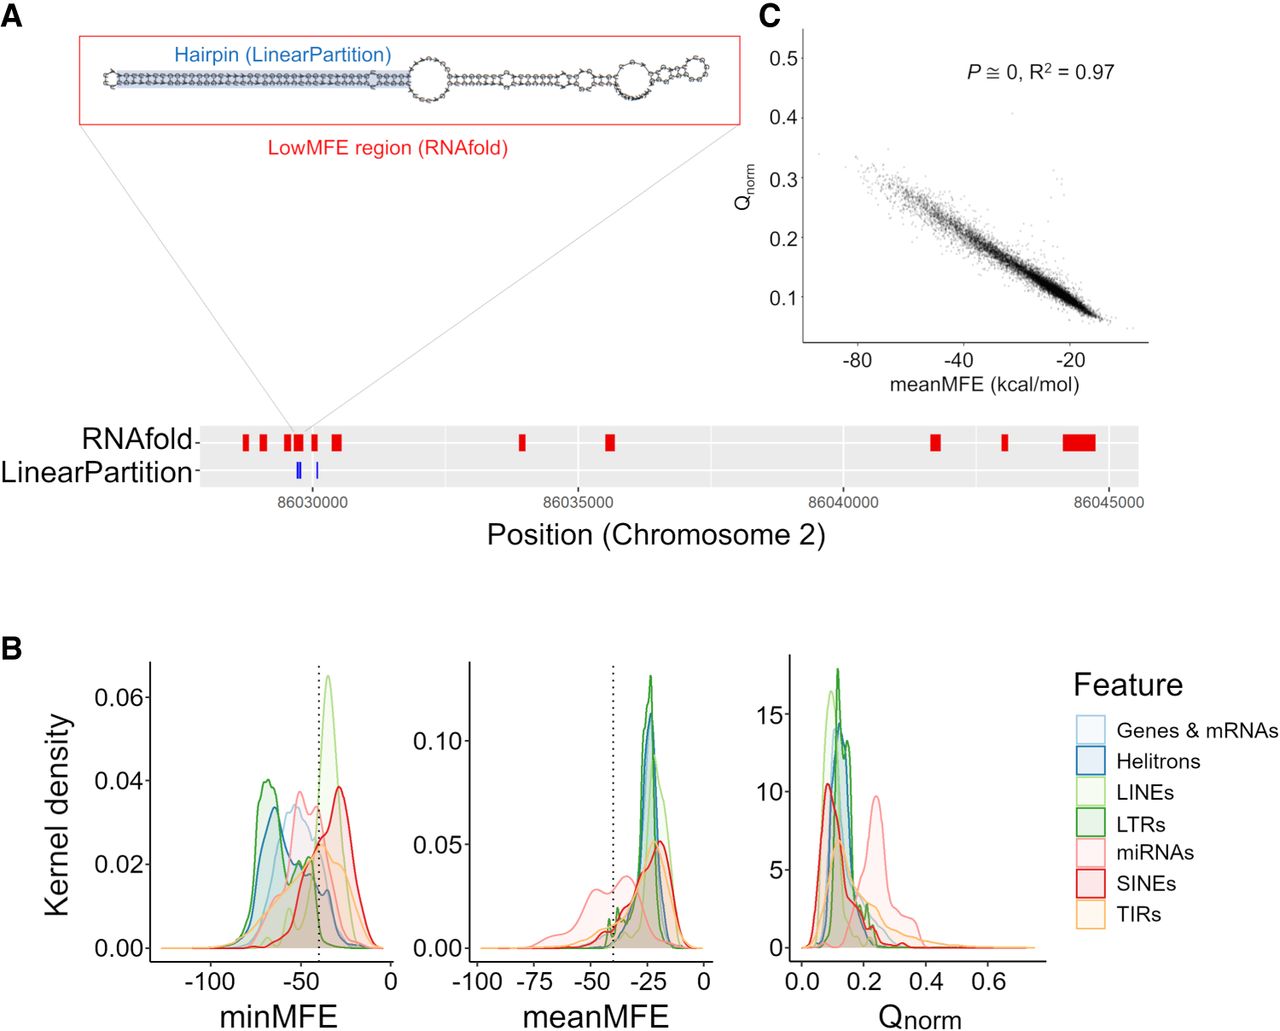
Characteristics of miRNA-like secondary structures across two methods. (A) A schematic contrasting the two prediction methods for a genic region on Chromosome 2. The LinearPartition (LP) method focuses on identifying small regions with hairpin characteristics, and the RNAfold method focuses on regions with low minimum free energy (MFE). This example illustrates lowMFE regions in red, with overlapping LP-hairpins in blue. Note that lowMFE regions exceed 110 bp, because they represent the concatenation of overlapping windows with MFE < −40 kcal/mol. (B) The correlation between meanMFE and Qnorm based on 39,179 genes. (C) The distributions of three summary statistics—minMFE, meanMFE, and Qnorm—across seven feature categories. In the key, helitrons correspond to DHH elements (for the three letter designations, see Table 2); LTRs consist of RLC, RLG, and RLX; LINEs are the RIL and RIT elements; SINEs are RST; and terminal repeat elements consist of DTA, DTC, DTH, DTM, and DTT elements.


