
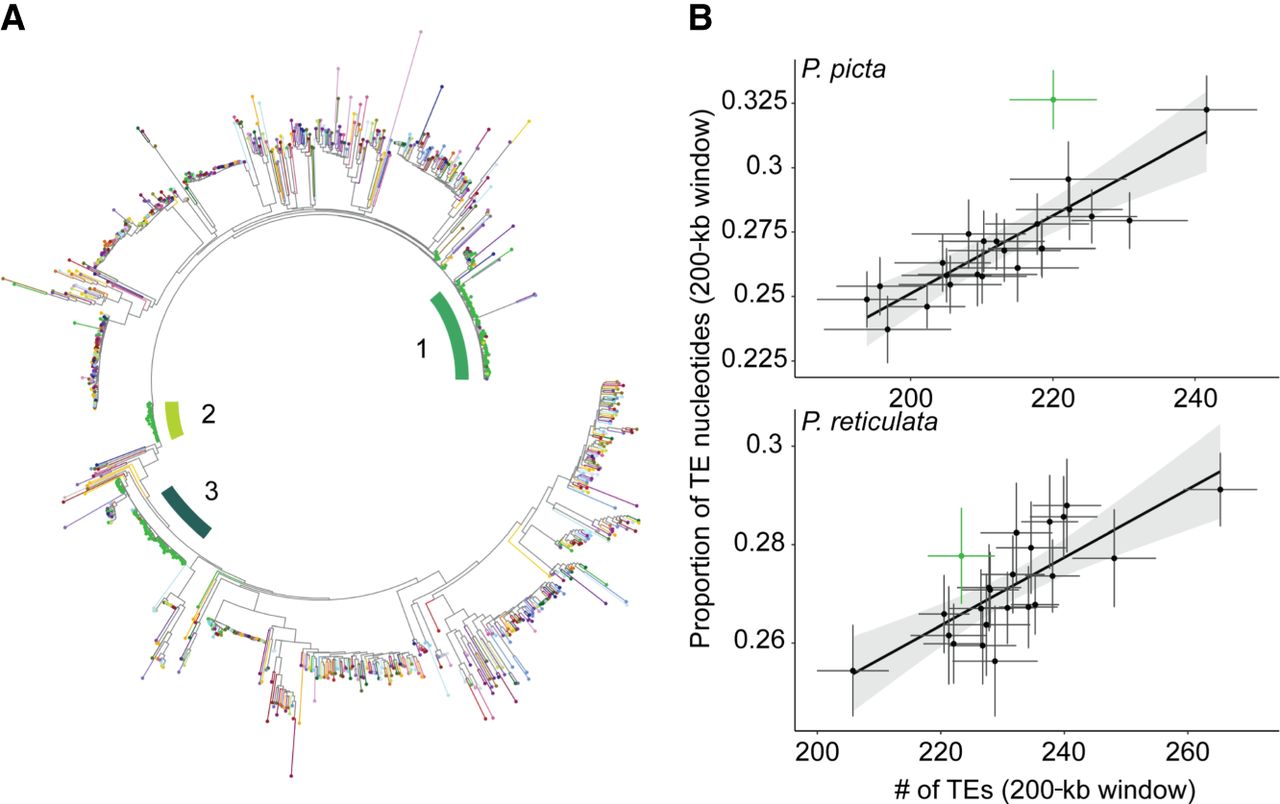
Recent expansion of repetitive elements containing YY1 motifs on the X Chromosome in P. picta. (A) Circular phylogeny of repetitive sequences containing at least one YY1 motif. Chromosomes are indicated by different colors as in Figures 1 and 2, with the X Chromosome in green. Green bars indicate the three clades where sequences are almost exclusively derived from the X Chromosome. (B) Relationship between the length and number of repetitive elements on each chromosome. Each point represents mean values in 200-kb bins for each chromosome (green indicates X). The proportion of TE nucleotides is calculated as the total number of TE nucleotides in a 200-kb bin. The number of TEs represents the total number of repetitive elements in 200-kb bins. Error bars are SE, and the shaded region is the 95% confidence interval line around the linear regression (solid black line).


