
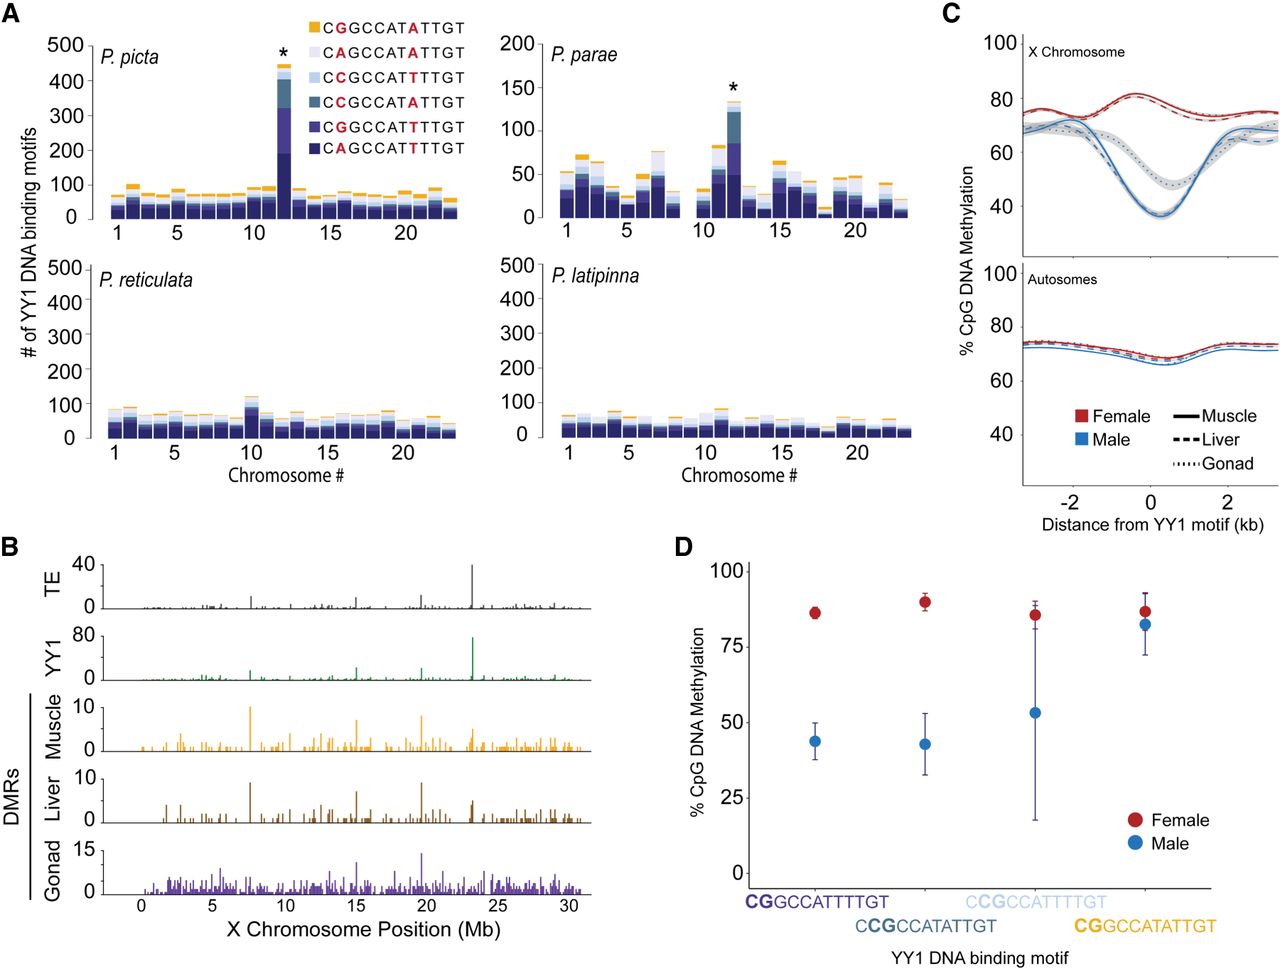
YY1 motif accumulated on the P. picta X Chromosome (Chromosome 12) and shows sex-specific DNA methylation. (A) Bar plots depict the chromosomal distribution of YY1 motifs. Colors represent the different YY1 motif sequences provided in Table 1. Nucleotides highlighted in red represent the nucleotide positions that vary among motifs. An asterisk denotes a significant enrichment in the total number of YY1 motifs on Chromosome 12 compared with autosomes based on results from a t-test with equal variance (P < 0.05). (B) Bar plots depicting the number of YY1 motif–containing transposable elements (TEs; gray), YY1 motif abundance (green), and male-specific hypomethylated regions in muscle (orange), liver (brown), and gonad (purple) tissue in 100-kb bins along the X Chromosome. (C) DNA methylation levels of genomic regions containing YY1 motifs ±2500 bp in females (red) and males (blue) on the X (top) and autosomes (bottom) presented as a loess regression (blue and red lines) with 95% confidence intervals in gray. Tissue-specific DNA methylation indicated by line type: Solid line indicates muscle; dashed line, liver; and dotted line, gonad. Zero marks the location of a YY1 motif. (D) Average DNA methylation values for CpG loci contained within YY1 motifs highlighted in large bold font on the x-axis. Data points represent the mean methylation value for the designated CpG loci for YY1 motifs on the sex chromosome in all tissues. Error bars represent 95% confidence intervals.


