
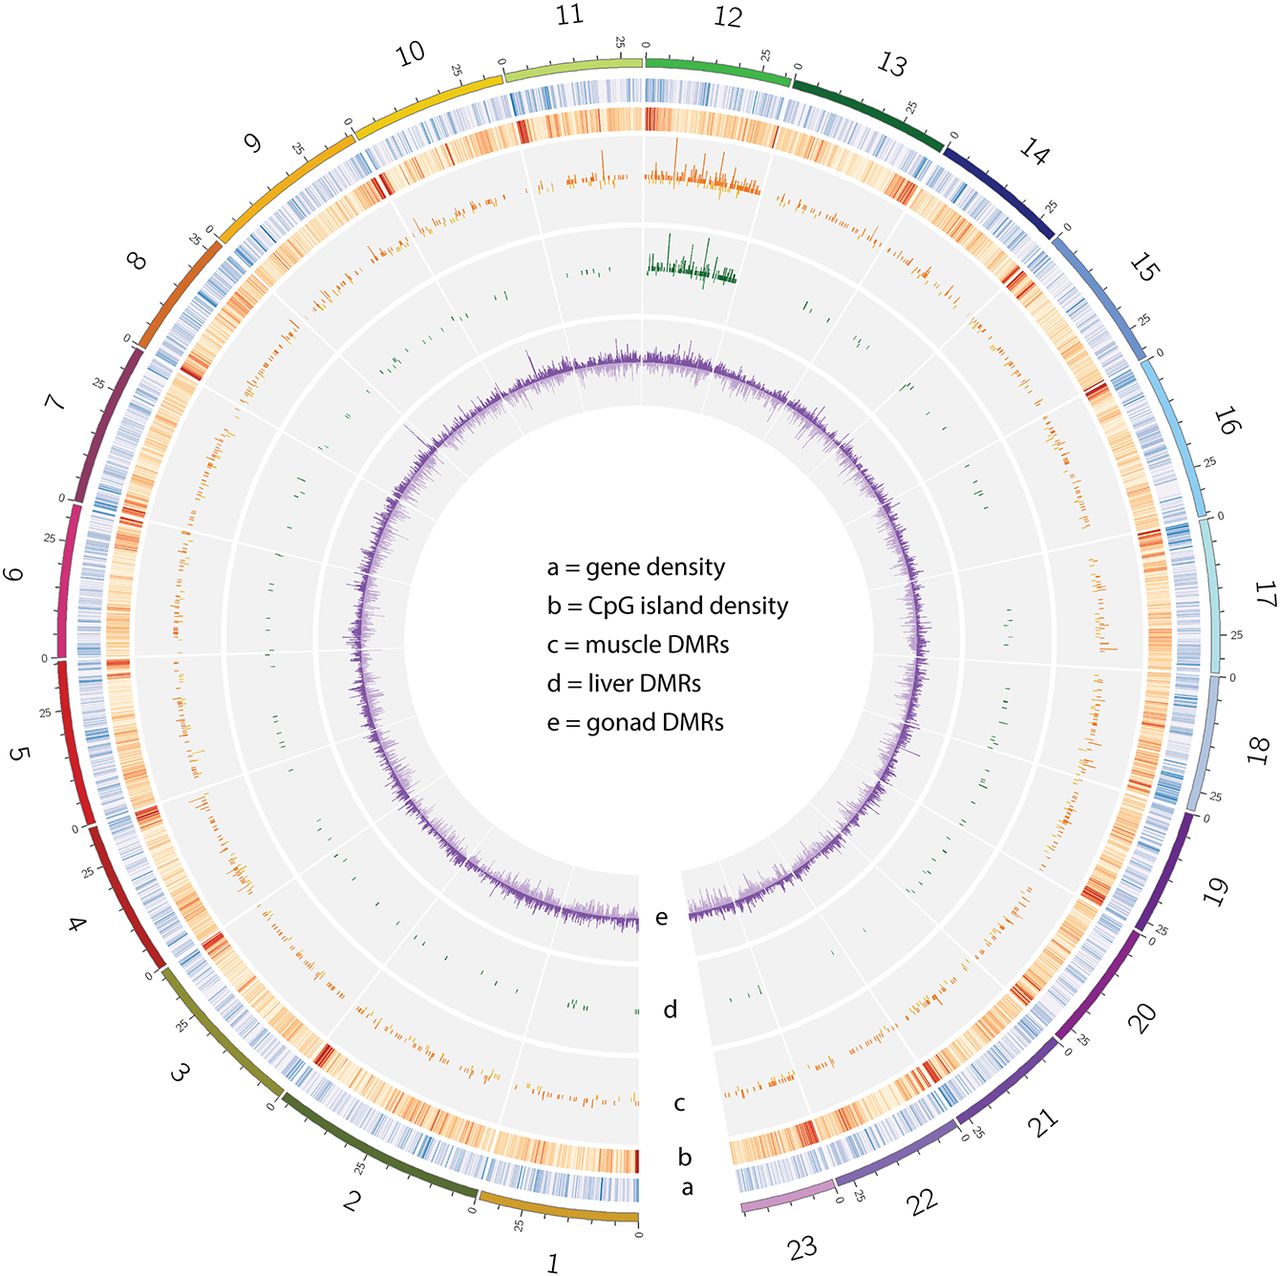
Distribution of sex-specific DMRs in P. picta. The outer ring of the Circos plot indicates chromosome number and megabase position. Chromosome colors are the same as in Figure 1. Tracks a and b are heatmaps depicting gene (blue) and CpG island (red) densities, each in 100-kb bins. Darker colors in the heatmap depict higher counts. Tracks c–e depict histograms of the number of differentially methylated regions (DMRs) in 100-kb bins in muscle (orange), liver (green), and gonad (purple) tissues. Histogram bars extending outward represent DMRs that are hypomethylated in males, and bars that extend toward the center of the plot represent DMRs that are hypomethylated in females. Chromosome 12 is the X Chromosome.


