
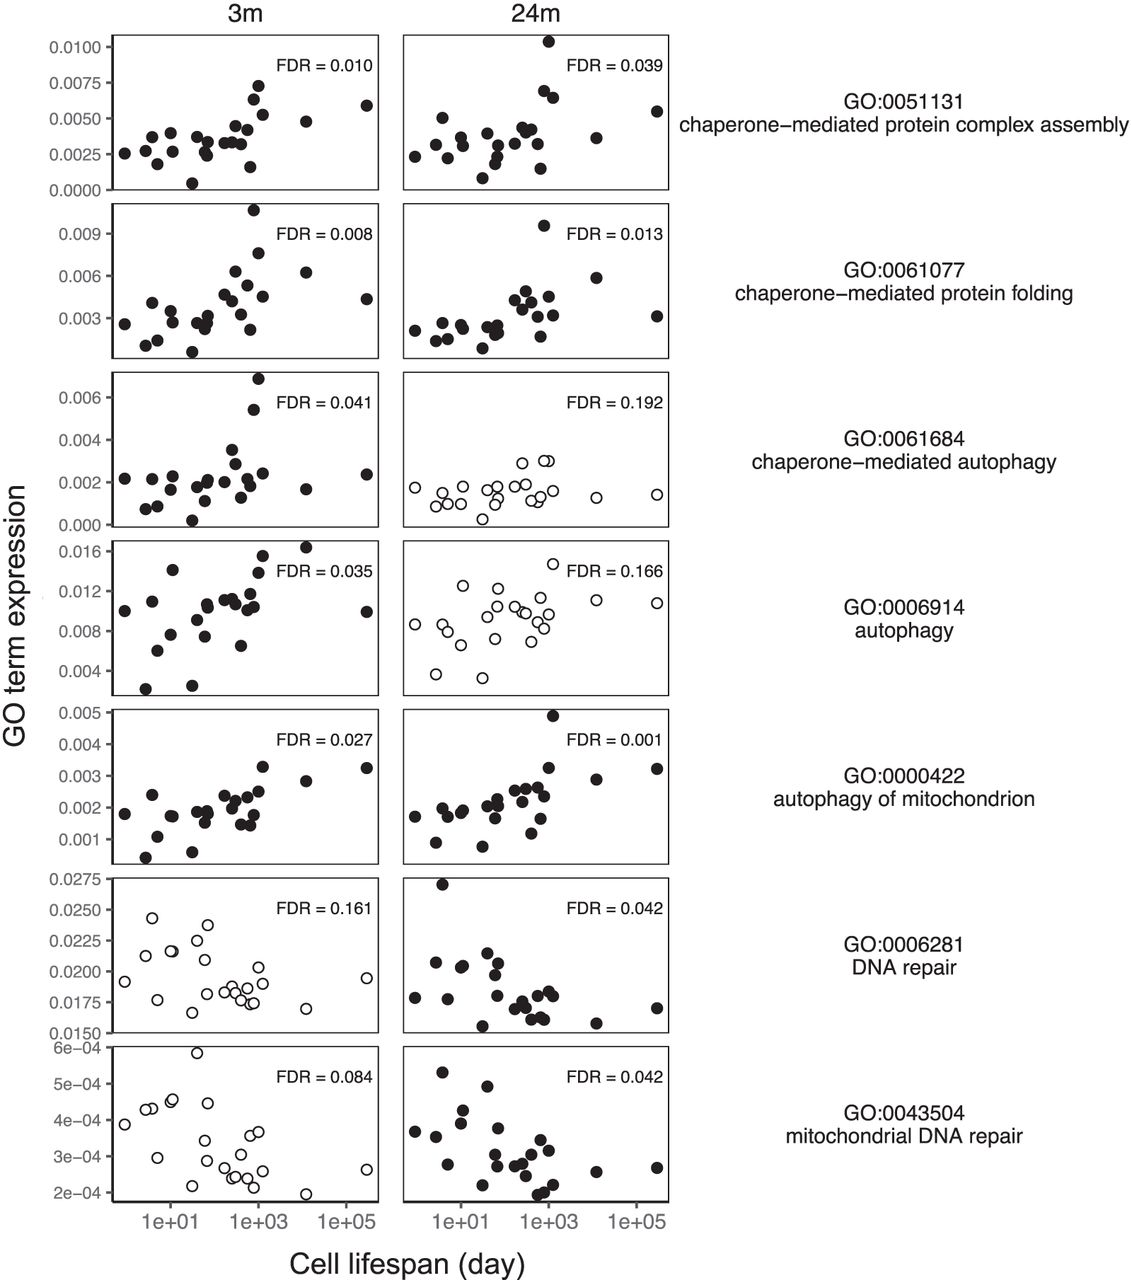
Figure 3.
Cell life span correlates with chaperone-mediated processes, mitochondrial autophagy, and DNA repair in mice. The mean expression of genes in each GO term in 22 cell types at young age (3 mo), and old age (24 mo) correlates with the life span of those cell types. Panels with filled circles show GO terms with a significant correlation with cell life span (the absolute Kendall's τ > 0.34, FDR < 0.05).


