
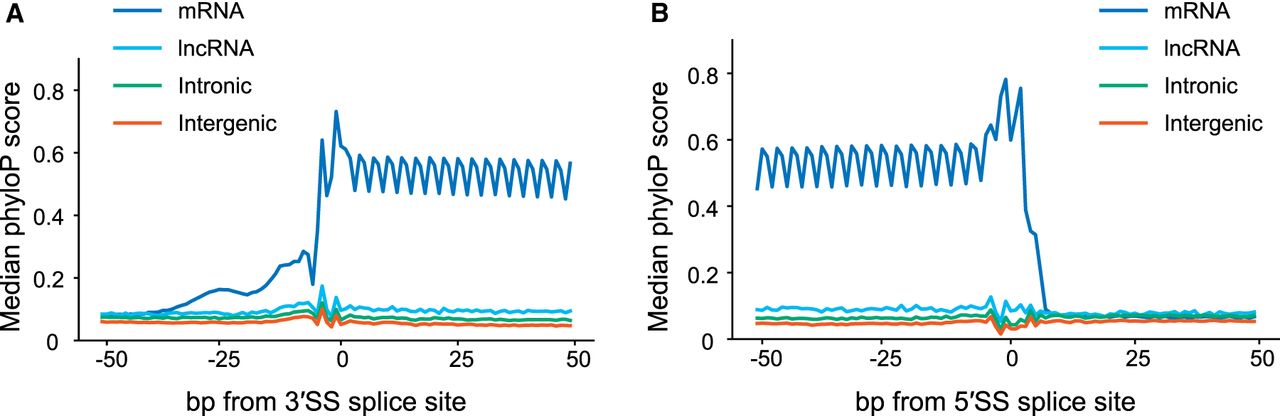
Figure 7.
Conservation around 3′ and 5′ splice sites of trapped exons. (A) Diagram depicting sequence conservation of trapped exons around 3′SS for different genomic regions. Shown are phyloP scores for the 100 bp region centered around the 3′SS for trapped exons from mRNA, lncRNA, and intergenic regions, as indicated. (B) Same as A except phyloP scores were calculated for the 100 bp region centered around the 5′SS for trapped exons.


