
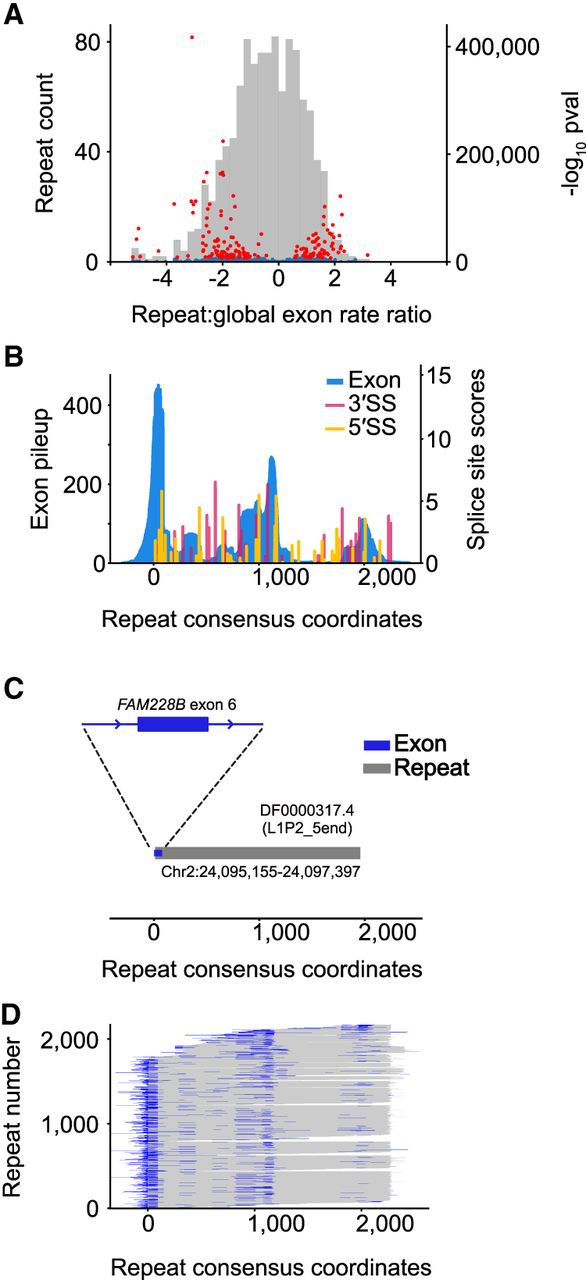
Exons overlapping repetitive elements. (A) Histogram depicts ratio of exon overlaps for different repeat families, relative to the global genomic exon rate. Volcano plot shows log10 P-values of repeat family exon bases enrichment (hypergeometric test) versus the repeat exon enrichment relative to the global exon rate. Red dots indicate top 5% of P-values. Blue dots indicate the bottom 95% of repeat-values. (B) Histogram pileup depicting sequencing reads overlapping repeat instances of DF0000317.4 (5′ end of L1 retrotransposon L1P2) in the human genome. Histogram maps sequencing reads in the genome to the Dfam repeat consensus model. MaxEntScan 3′SS and 5′SS scores are also shown across the Dfam repeat consensus model with scores above 0 shown with colored bars. Repeat consensus coordinates start at 0. (C) Diagram depicting overlap between trapped exon 6 from FAM228B (Chr 2: 24,095,141–24,095,230) and a genome instance of L1P2 transposon DF0000317.4 (Chr 2: 24,095,155–24,097,397). (D) Diagram depicting overlap between all trapped exons and associated genomic repeat instances for L1P2 transposon DF0000317.4. Rows are sorted by repeat start and end coordinates for the Dfam repeat consensus model.


