
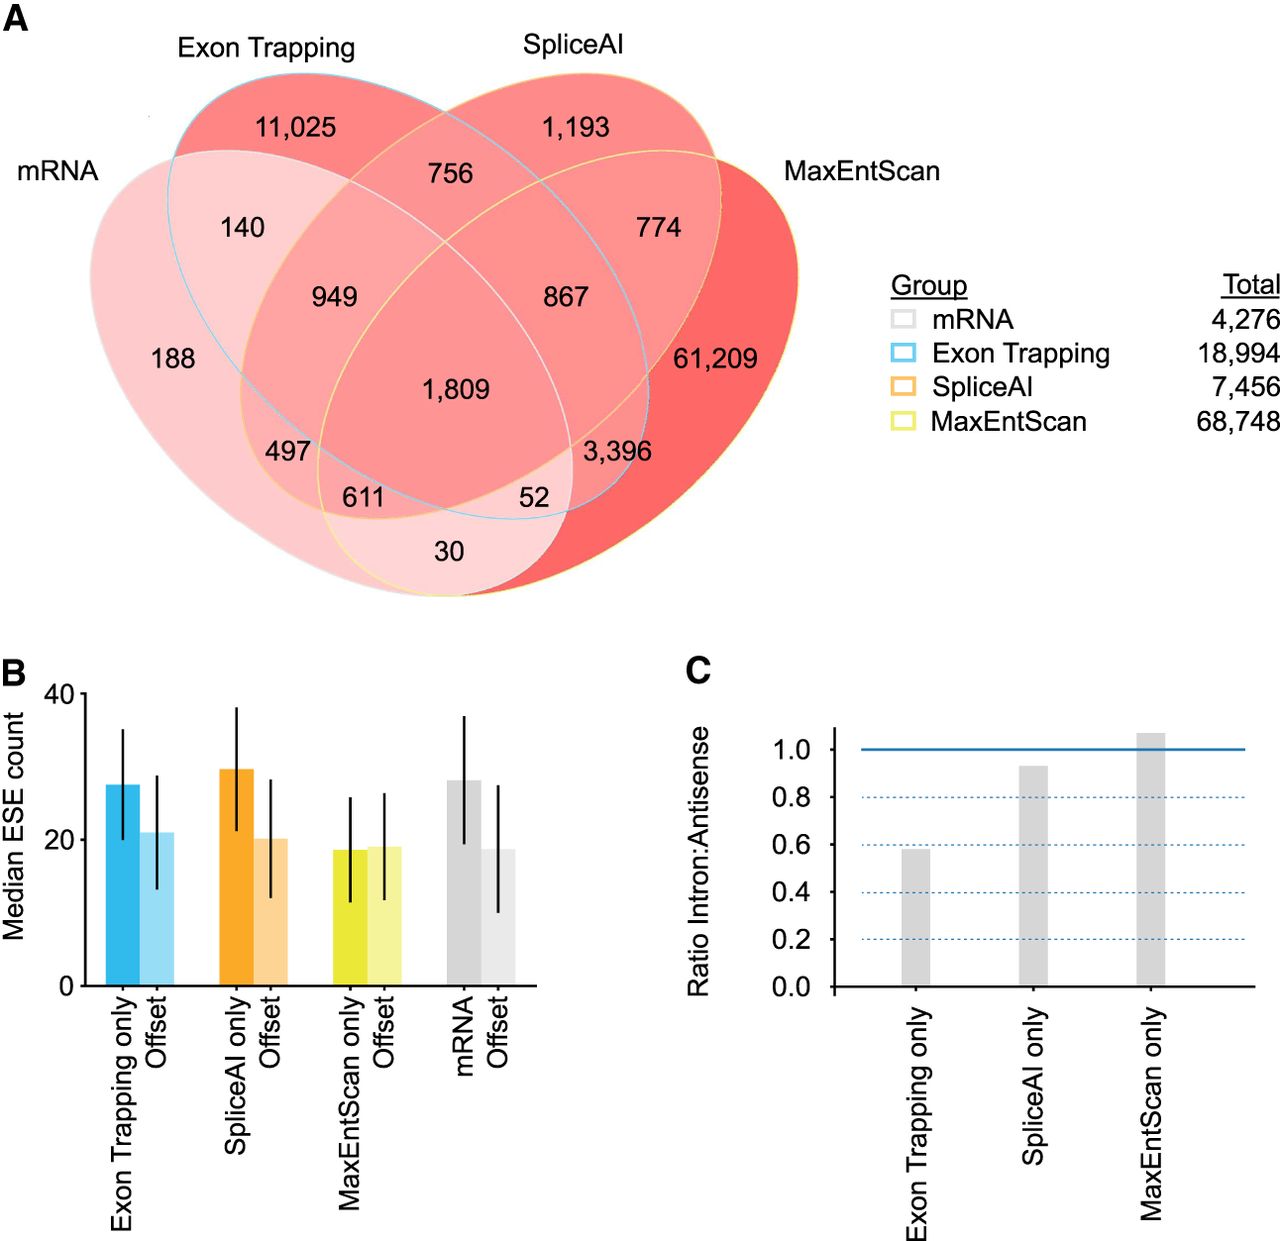
Overlaps between exons detected using different approaches. (A) Venn diagram depicting Chromosome 17 forward strand exons found by different exon calling approaches. Exons are labeled as mRNA (annotated mRNA & lncRNA internal exons), ET (exons found by exon trapping), MaxEntScan (based on MaxEntScan scoring), and SpliceAI (based on SpliceAI scoring). Exon counts corresponding to overlapping regions are indicated and are colored red linearly with intensity determined by (log10 #exons). (B) Bar plot of median ESE counts for exons and offset sequences identified using approaches listed in A. Offset sequences are the same length as the associated exon and correspond to coordinates 500 bp upstream for reverse strand exons and 500 bp downstream for forward strand exons. For forward strand exons this is downstream from the exon and for reverse strand exons this is upstream of the exon. Range lines indicate 25th–75th percentiles. Refer to A for x-axis labels. (C) Bar plots showing the ratio of intronic to antisense exon counts found for the different exon finder approaches.


