
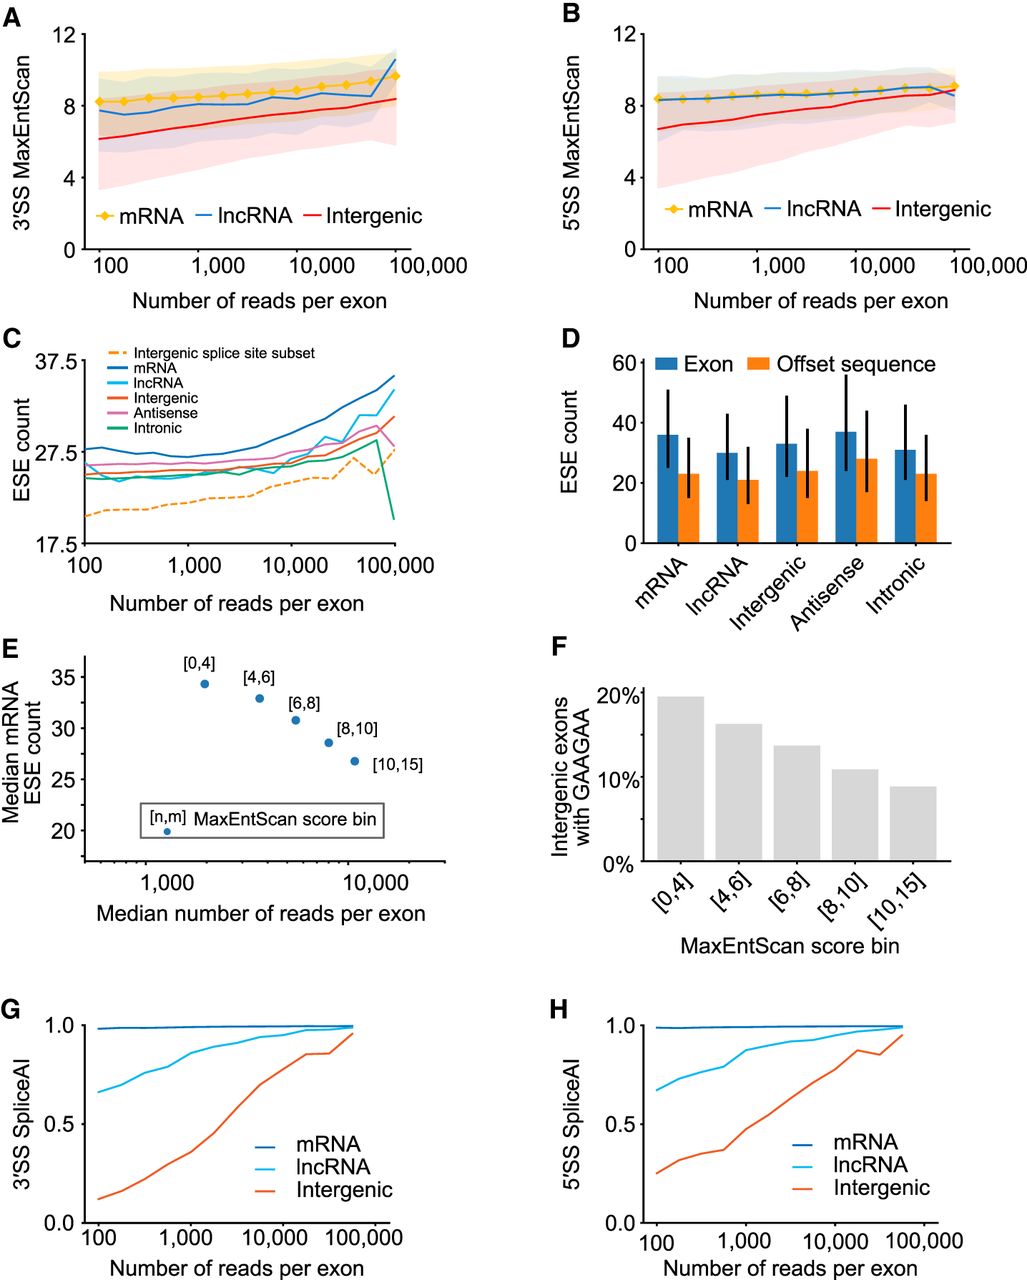
Known splicing signal correlations with exon read counts. (A) Line plots depicting 3′ MaxEntScan scores for trapped exons from different genomic regions. Exons from mRNA, lncRNA, and Intergenic regions are indicated and are binned by logarithmic read counts. Median values are displayed as lines with shaded region corresponding to 25th–75th percentiles. (B) Same as A, above, but depicting 5′ MaxEntScan scores. (C) Line plots representing Splicing Enhancer (ESE) counts for trapped exon sequences from different genomic regions. ESE median values are displayed, and exons are binned by their logarithmic sequencing read counts using logarithmic bins ranging from 100 to 10,000. (D) Bar plots depicting the median ESE counts for trapped exons (blue bars) and nearby sequence of the same length offset by 250 bp (orange bars) for different genomic regions. Offset sequences are the same length as the associated exon and correspond to coordinates 250 bp upstream for reverse strand exons and 250 bp downstream for forward strand exons. For forward strand exons this is downstream from the exon and for reverse strand exons this is upstream of the exon. Range lines indicate 25th–75th percentiles. (E) Scatter plot representing ESE count (y-axis) versus median sequencing read count (x-axis) for trapped exons, subdivided by MaxEntScan scores into groups with weaker to stronger splice sites based on splice site score bin (point label). Splice site bins indicate that contained exons have both their 3′SS and 5′SS splice sites within the labeled MaxEntScan score boundaries, between values indicated by [n,m], where n = lower score and m = upper score. (F) Bar plot depicting fraction of intergenic exons that contain the ESE GAAGAA nucleotide sequence. Individual bars correspond to exons with both 3′SS and 5′SS MaxEntScan scores (see E, above) within the range given in the bar label (e.g., [n < splice site MaxEntScan score < m] for both 3′SS and 5′SS MaxEntScan scores). (G) Line plots depicting 3′SS SpliceAI scores for trapped exons in different genomic regions. Values in the x-axis are logarithmic sequencing read counts using bins from 100 to 10,000 with 25 steps. For intergenic exons, the Spearman's correlation between SpliceAI scores and read counts is 0.31. (H) Same as G, above, except for 5′SS SpliceAI scores. For intergenic exons, the Spearman's correlation between SpliceAI scores and read counts is 0.12.


