
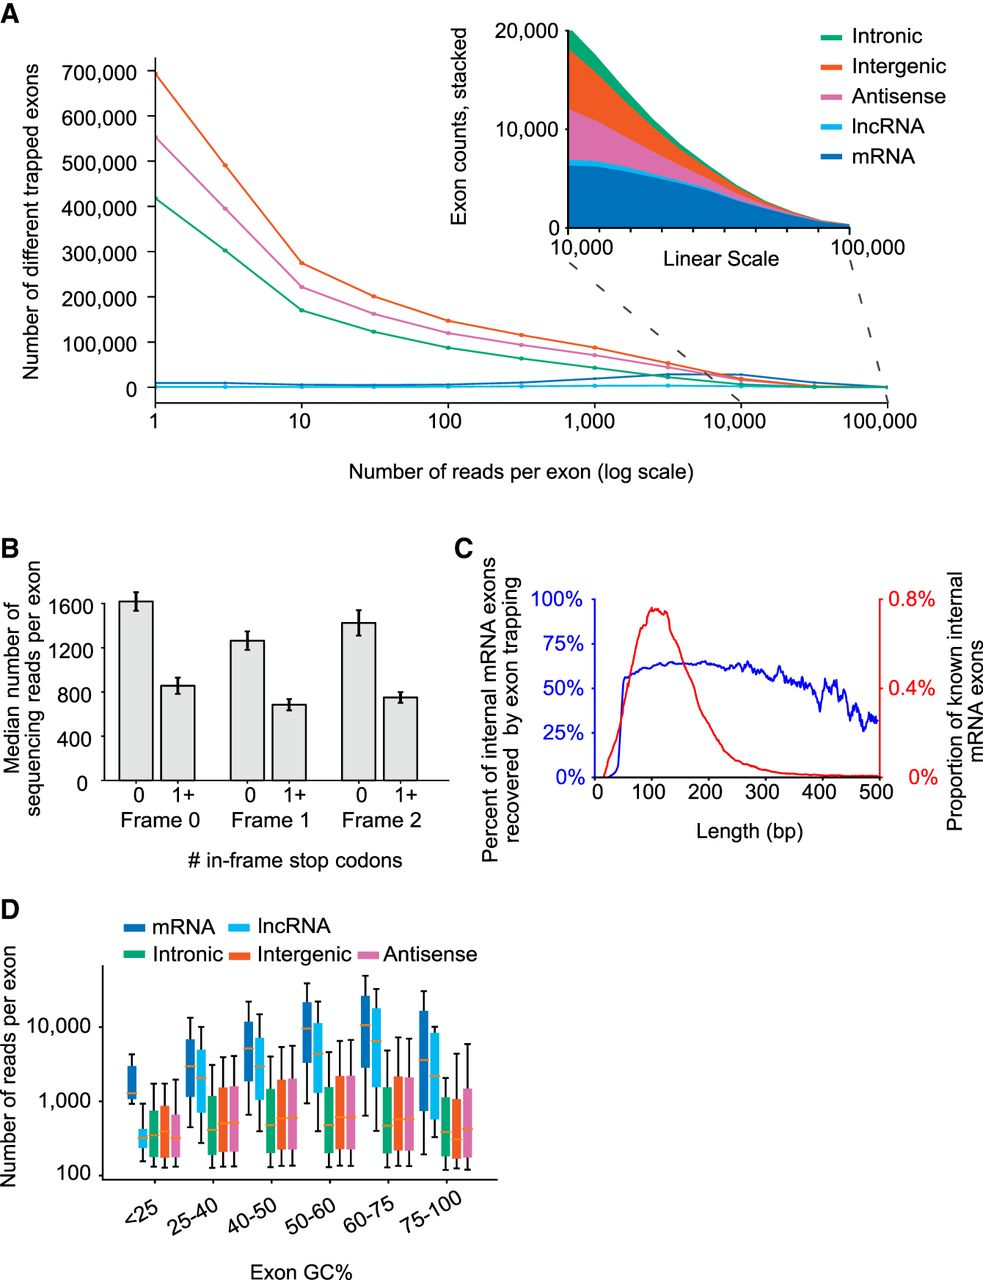
Properties of trapped exons. (A) Histograms of sequencing read counts for trapped internal exons within different genomic regions. Outset plot shows logarithmic exon counts and inset shows zoomed linear exon counts. Logarithmic bin boundaries indicated by dots corresponding to 10x for x from 0 to 5 with step size 0.5. Linear bin boundaries range from 100 to 100,000 with a step size of 1000. (B) Bar plots depicting sequencing read counts of internal exons containing zero or at least one in-frame stop codon. Results for reading frames in the first (“Frame 0”), second (“Frame 1”), and third (“Frame 2”) positions are shown. (C) Line plots depicting the distribution of mRNA exon lengths and the percent of mRNA exons at each length recovered by exon trapping. Plots have a 9 bp smoothing window applied. (D) Boxplots depicting GC content of trapped internal exons from different genomic regions. y-axis indicates sequencing read counts of trapped exons, within indicated GC content ranges (x-axis). Whiskers indicate 10th and 90th percentiles.


