
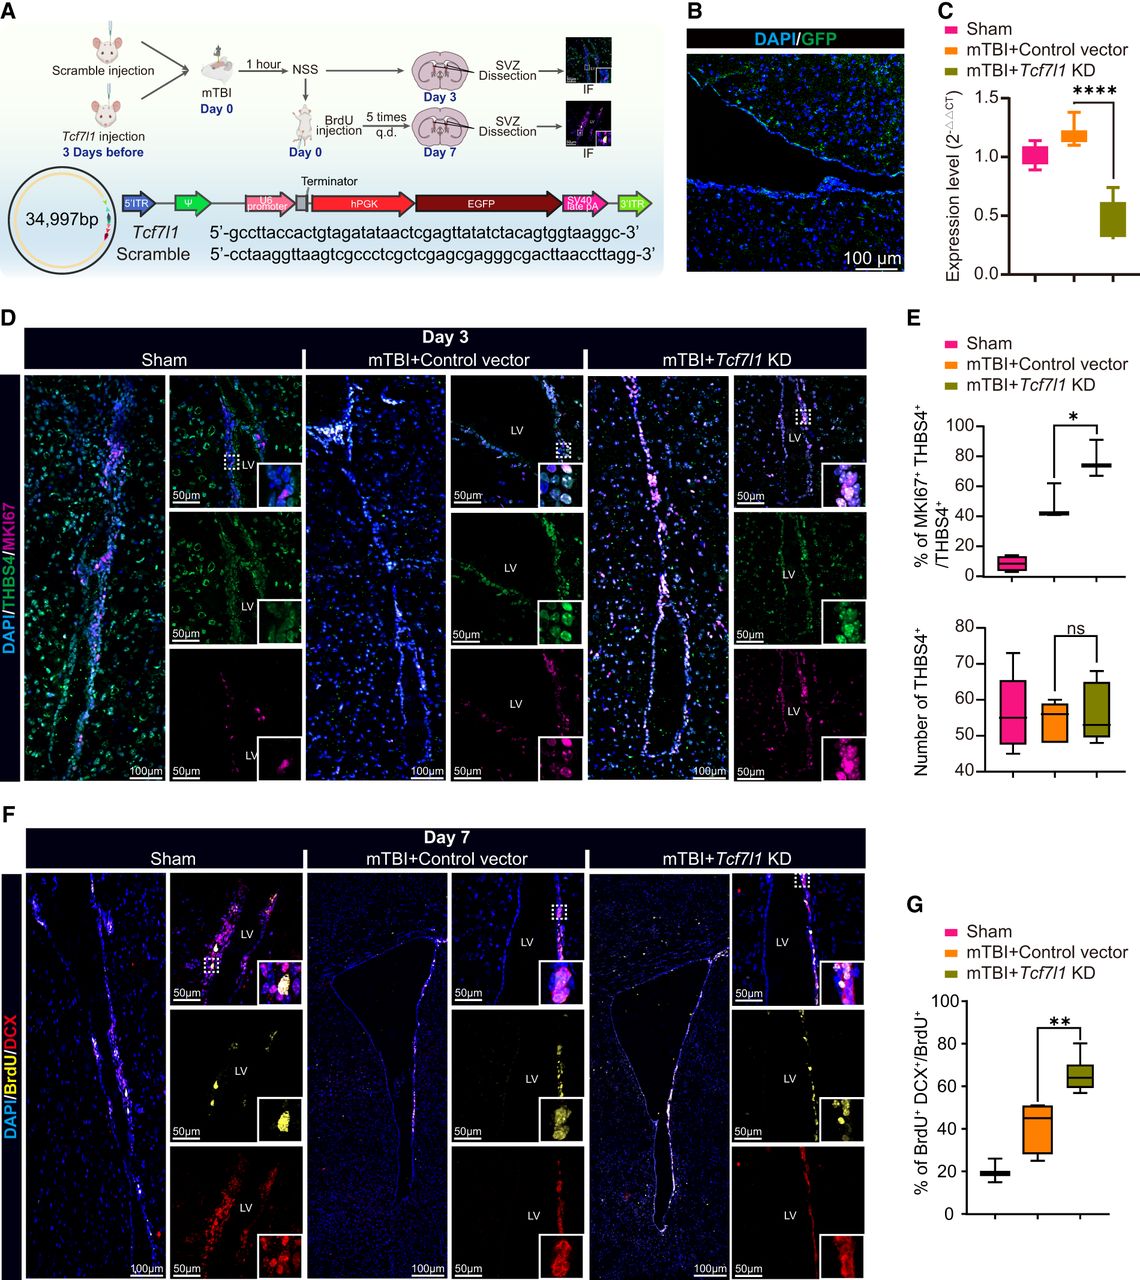
Suppressing Tcf7l1 promotes neuronal differentiation of the SVZ NSCs after mTBI. (A, top) Schematic diagram of in vivo experiment. (Bottom) Schematic representing the adenovirus injection, along with its genetic sequence. (B) GFP signal indicating successful SVZ injection of the adenovirus. (C) qPCR assay of Tcf7l1 indicating successful knockdown of Tcf7l1 in the SVZ. Expression levels were normalized to Gapdh. Three technical duplicates were performed in individual qPCR experiments. (D,E) Immunofluorescence staining (D) and THBS4+MKI67+/THBS4+ cell counting results (E) for THBS4 and MKI67 in the SVZ region from the sham, mTBI + control vector, and mTBI + Tcf7l1 vector. Tissues are counterstained with DAPI. The t-test was used to determine statistical significance: (*) P ≤ 0.05. (F,G) Immunofluorescence staining (F) and DCX+BrdU+/BrdU+ cell counting results (G) for DCX and BrdU in the SVZ region from the sham, mTBI + control vector, and mTBI + Tcf7l1 vector. Tissues are counter-stained with DAPI. The t-test was used to determine statistical significance: (**) P ≤ 0.01.


