
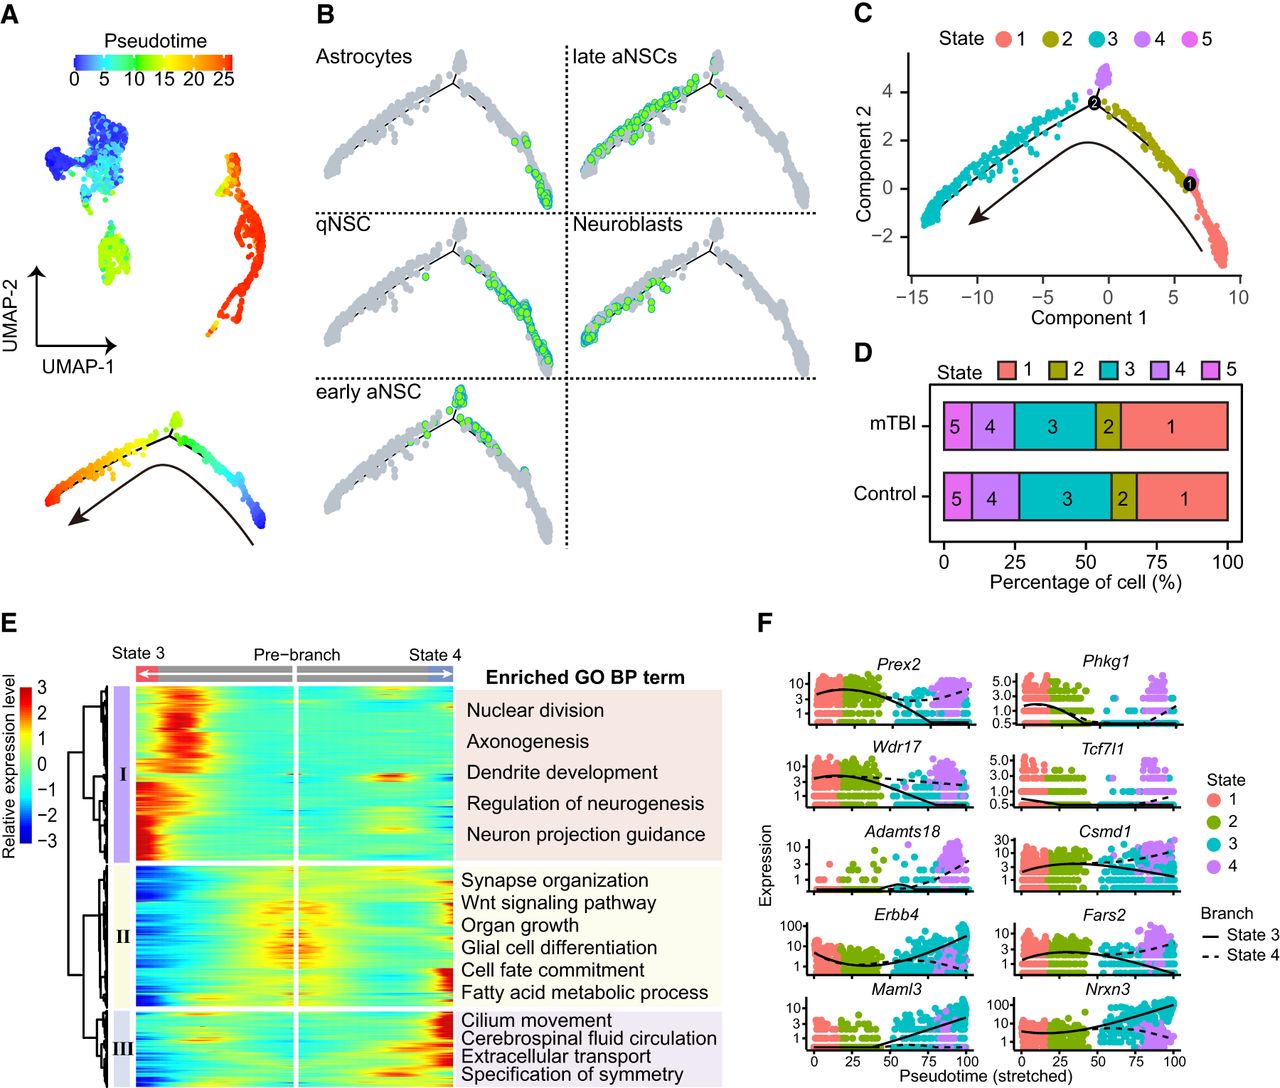
Pseudotime analysis reveals reprogramming trajectory of NSCs after injury. (A, top) Colored cells plotted onto the UMAP according to the pseudotime. (Bottom) Monocle2-generated pseudotemporal trajectory of NSCs & astrocytes. (B) Different astrocyte & NSC subtypes along the pseudotime trajectory. (C) Cell ordering from different differentiation stages along the pseudotime trajectory. (D) Bar plot showing the proportion of each differentiation stage in the control and the mTBI. (E, left) Heat map showing gene expression patterns along the pseudotime (1000 genes). (Right) Three clusters were identified based on the expression dynamics; the GO term for each cluster was displayed on the right column. (F) Expression pattern of representative genes during differentiation from aNSCs to neuroblasts. States are shown in colors, and branches are indicated by lines.


