
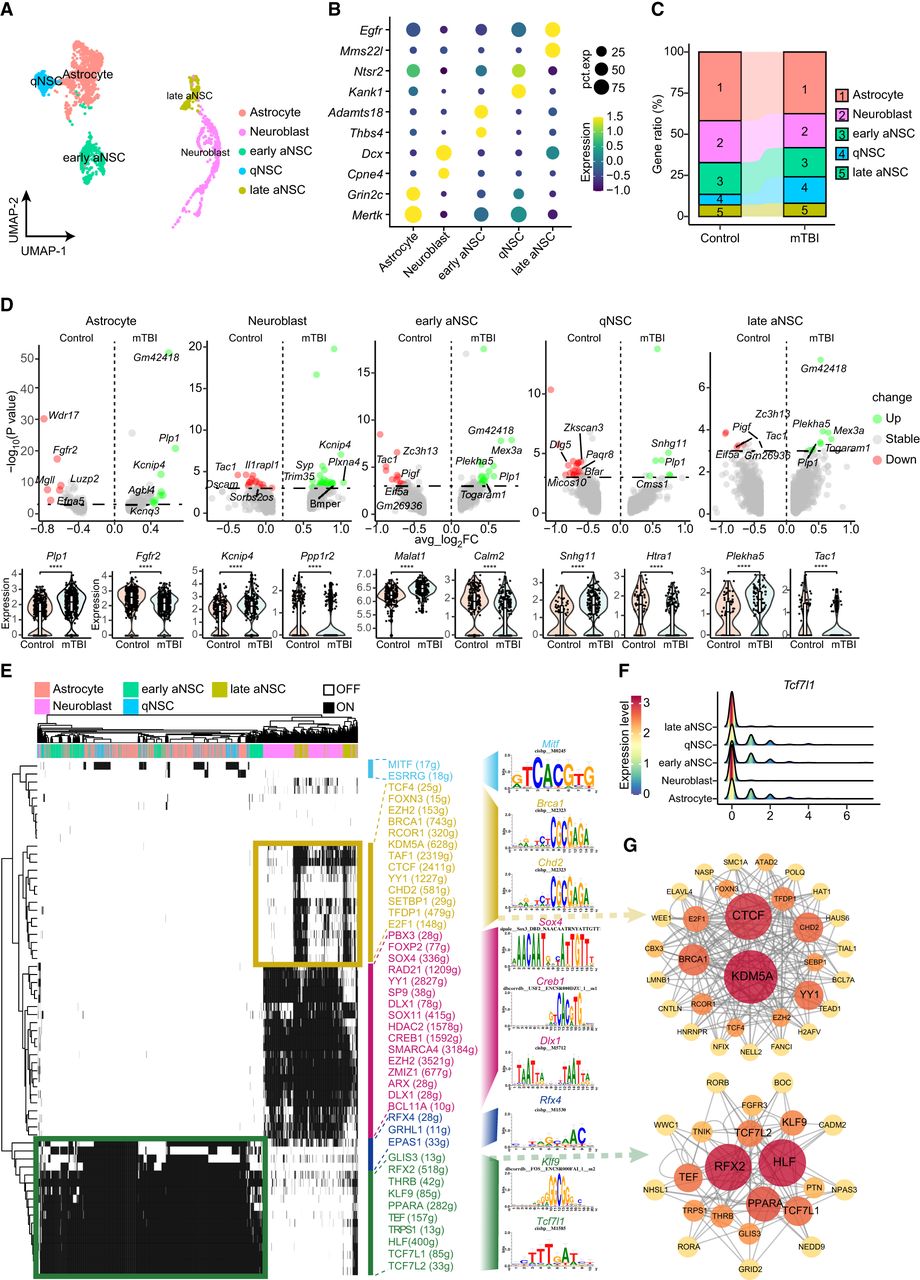
NSC & astrocyte diversities in the niche and their alteration post-mTBI. (A) UMAP plot showing five subtypes of NSCs & astrocytes. (B) Dot plot showing the representative markers for each subtype. A gradient of light purple to yellow indicates inhibition to activation of the term. Size of the bubble indicates the P-value. (C) Bar plot showing the proportion of each cell types in the control and mTBI group. (D, top) Volcano plot showing DEGs in the control and mTBI group. (Bottom) Violin plot showing up-regulated and down-regulated genes in each cell type. The t-test was used to determine statistical significance: (****) P ≤ 0.0001. (E) SCENIC results of the control and mTBI group. Major regulators were shown; their corresponding enriched DNA-binding motifs are shown in right column. (F) Ridge plot showing the expression of Tcf7l1. (G) Protein–protein interaction (PPI) networks of TFs and miRNAs in neuroblast (upper) and astrocyte, qNSC, and early aNSC (lower).


