
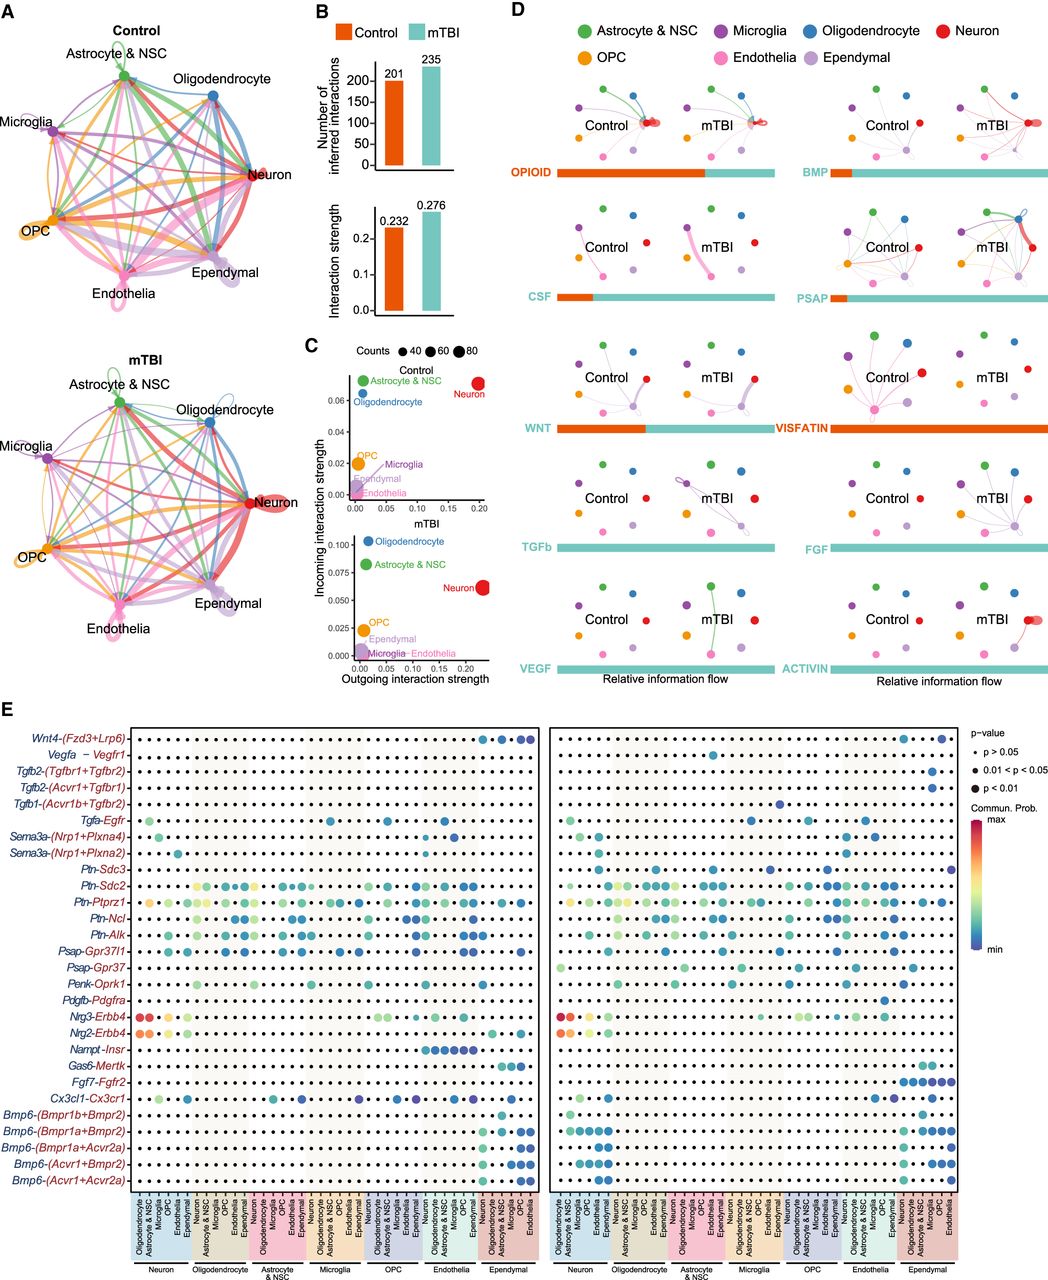
Alterations of the cell–cell cross talk in the SVZ after mTBI. (A) Cell–cell communication signaling network among major cell types analyzed with CellChat. The width of the lines indicates the number of pairs; different colors represent different signal sources. (B) Bar plot showing the number of inferred interactions and the proportion of interaction strength in the control and the mTBI. (C) The location of major cell types based on the count of their significant incoming (y-axis) or outgoing (x-axis) signaling pattern. (D) Signal pathway network and bar plot showing the expression of specific signaling pathways in the control and the mTBI SVZ. The width of the lines indicates signal strength. (E) Dot plot showing the pairing of ligands (red) and receptors (blue) in the control and the mTBI SVZ.


