
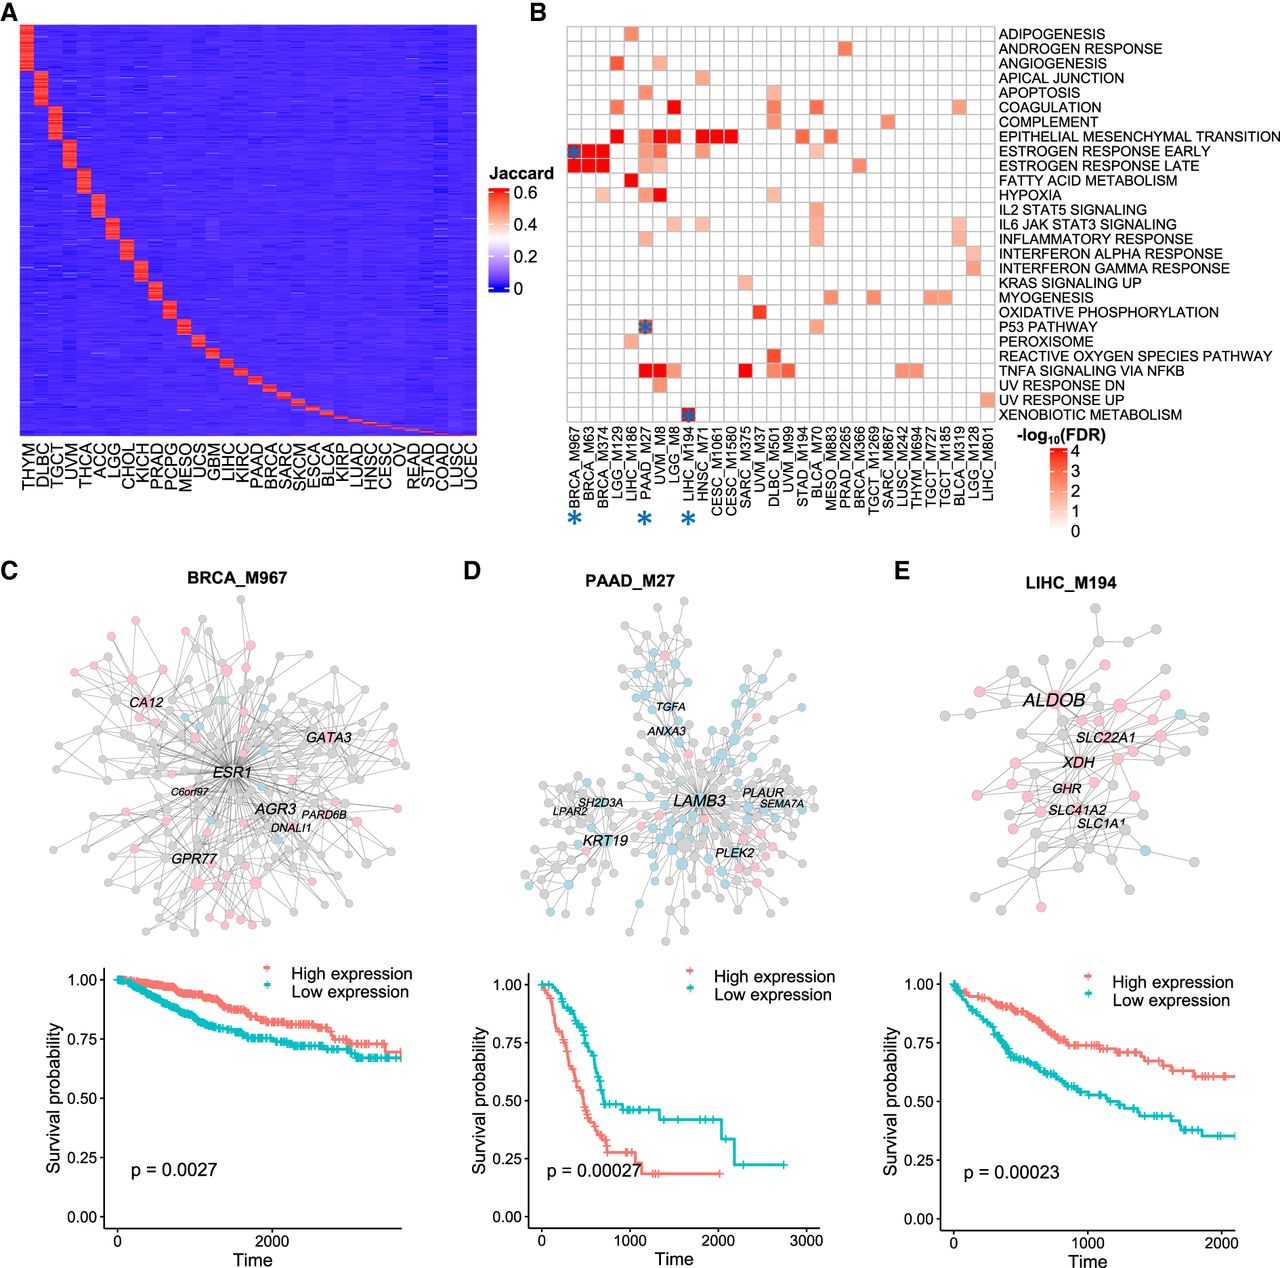
Cancer-type-specific prognostic modules. (A) Heatmap showing cancer-type-specific modules. Rows represent specific modules, and columns represent cancer types. Color intensity indicates the Jaccard index of the most similar module in each cancer type. (B) Heatmap showing the top 30 modules with significant enrichment for hallmark pathways. Color intensity in the heatmap is proportional to pathway enrichment. Asterisks highlight candidate cancer-specific modules for survival plots and unique biological functions. (C–E) Coexpression networks and survival plots of cancer-type-specific prognostic modules. In the network plots, the pink and light blue colors indicate genes associated with better and worse survivals, respectively. The names of hub genes in the network modules are labeled.


