
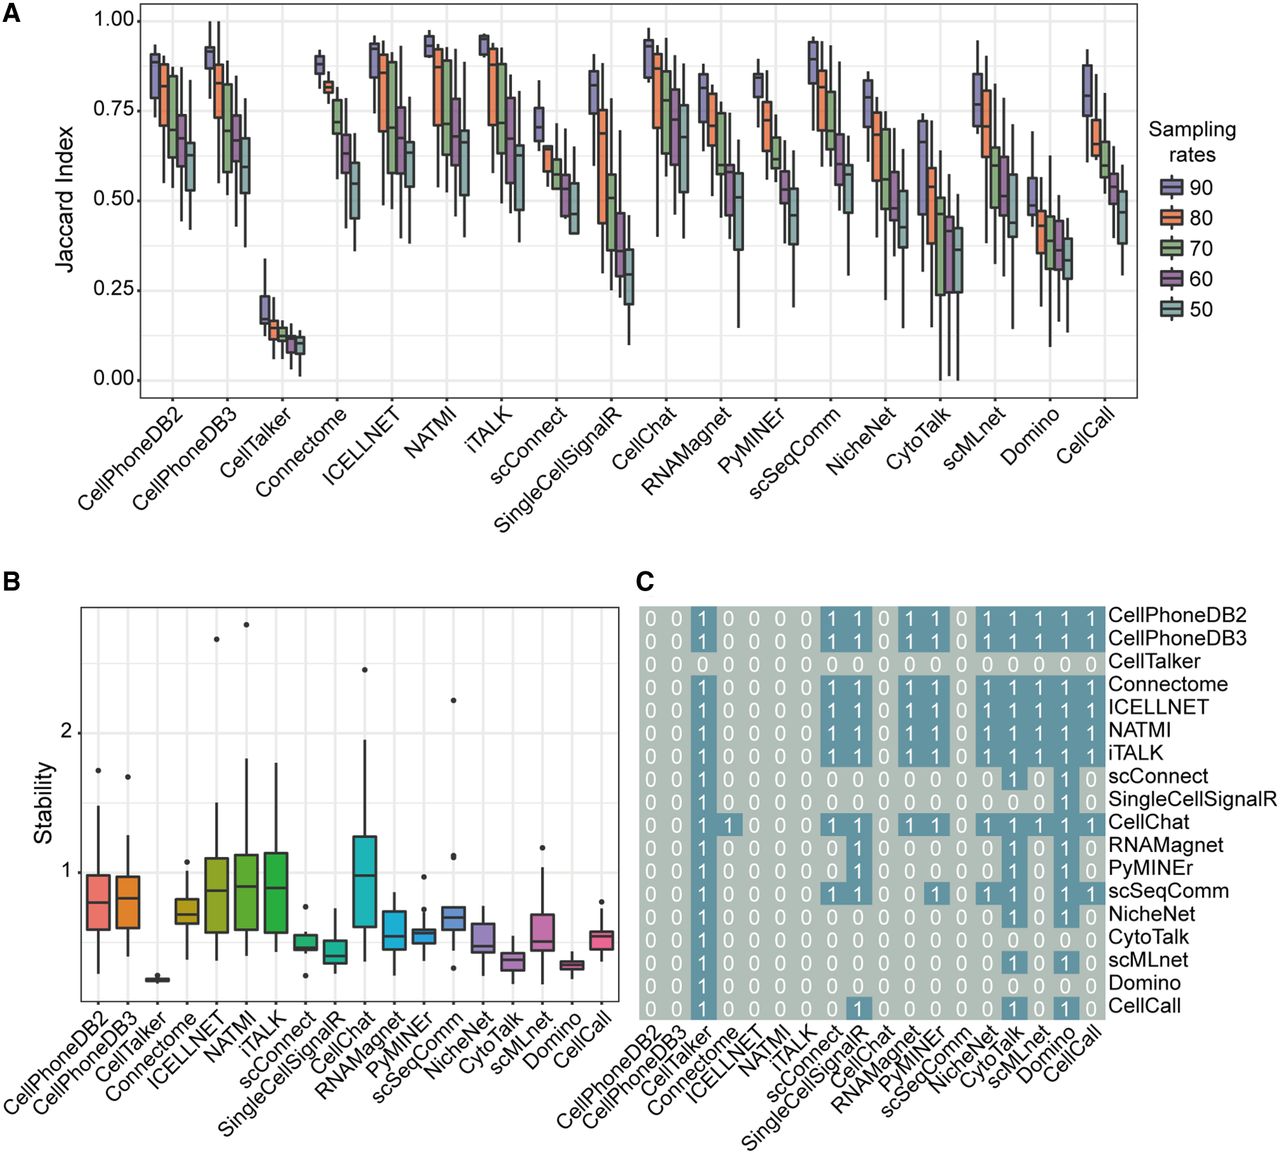
Figure 7.
Stability of the 18 LR inference methods to different sampling rates of the input scRNA-seq data. (A) Box plot of Jaccard index values between LR interactions predicted from the sampled data sets and those from the original data sets for each method. (B) Box plot of the overall stability values of each method. (C) Heatmap of statistical significance of difference of the overall stability values between different methods. 1 represents that the overall stability values of the method in row are significantly higher than those of the method in column (P < 0.05), otherwise for 0.


