
Abstract
Cell-cell communication (CCC) is critical for determining cell fates and functions in multicellular organisms. With the advent of single-cell RNA-sequencing (scRNA-seq) and spatial transcriptomics (ST), an increasing number of CCC inference methods have been developed. Nevertheless, a thorough comparison of their performances is yet to be conducted. To fill this gap, we developed a systematic benchmark framework called ESICCC to evaluate 18 ligand-receptor (LR) inference methods and five ligand/receptor-target inference methods using a total of 116 data sets, including 15 ST data sets, 15 sets of cell line perturbation data, two sets of cell type–specific expression/proteomics data, and 84 sets of sampled or unsampled scRNA-seq data. We evaluated and compared the agreement, accuracy, robustness, and usability of these methods. Regarding accuracy evaluation, RNAMagnet, CellChat, and scSeqComm emerge as the three best-performing methods for intercellular ligand-receptor inference based on scRNA-seq data, whereas stMLnet and HoloNet are the best methods for predicting ligand/receptor-target regulation using ST data. To facilitate the practical applications, we provide a decision-tree-style guideline for users to easily choose best tools for their specific research concerns in CCC inference, and develop an ensemble pipeline CCCbank that enables versatile combinations of methods and databases. Moreover, our comparative results also uncover several critical influential factors for CCC inference, such as prior interaction information, ligand-receptor scoring algorithm, intracellular signaling complexity, and spatial relationship, which may be considered in the future studies to advance the development of new methodologies.
Cell-cell interactions play crucial roles in many physiological and pathological processes, such as cell differentiation, tissue development, immunity, and diseases (e.g., cancers, inflammation, and metabolic diseases) (Livesey and Cepko 2001; Hotamisligil 2006; Quail et al. 2016). Therefore, elucidating the mechanisms by which intercellular signaling regulates cell fate determination and the functioning of cell-cell interactions is essential for mechanistic and therapeutic understanding of the diseases.
Cell interactions occur in many forms, such as physical cell-cell contact (e.g., cell adhesions) (Parsons et al. 2010; Boisset et al. 2018) and cell-cell communication (CCC) (e.g., autocrine, paracrine, or endocrine) mediated by intercellular ligand-receptor (LR) interactions (Armingol et al. 2021). A comprehensive CCC process typically encompasses multilayered signaling events, spanning intercellular LR interactions and intracellular signaling transduction, alongside transcriptional regulation (Zhang et al. 2020; Almet et al. 2021; Cheng et al. 2021). Therefore, computational inference of CCCs pursues two main objectives: quantifying intercellular LR signaling and deducing the interplay between intercellular signaling and intracellular responses.
The development of single-cell RNA-sequencing (scRNA-seq) technology provides an unprecedented opportunity for CCC inference in a high-throughput manner (Armingol et al. 2021). The scRNA-seq data can detect gene expression of individual cells of different types or origins; therefore, it can be used to analyze LR interaction-mediated CCCs (Lee et al. 2014). Since 2019, an increasing number of CCC inference methods based on scRNA-seq data have been developed (Armingol et al. 2021), which can be divided into two categories: (1) methods for inferring intercellular signaling networks (e.g., CellPhoneDB [Efremova et al. 2020] and CellChat [Jin et al. 2021]), and (2) methods for inferring both intercellular and intracellular signaling networks (e.g., scMLnet [Cheng et al. 2021] and NicheNet [Browaeys et al. 2020]). Furthermore, advancements in spatial transcriptomics (ST) technology (Marx 2021) have made it possible to incorporate spatial information of cells and genes in the CCC inference. Recently, several ST data-based CCC inference methods have been proposed, such as MISTy (Tanevski et al. 2022), HoloNet (Li et al. 2023a), and stMLnet (Cheng et al. 2022).
The existing CCC inference methods fall broadly into the following two categories: (1) LR inference methods, including CellPhoneDB v2.0 (Efremova et al. 2020), CellPhoneDB v3.0 (Garcia-Alonso et al. 2021), CellTalker (Cillo et al. 2020), Connectome (Raredon et al. 2022), ICELLNET (Noël et al. 2021), NATMI (Hou et al. 2020), iTALK (Wang et al. 2019b), scConnect (Jakobsson et al. 2021), SingleCellSignalR (Cabello-Aguilar et al. 2020), RNAMagnet (Baccin et al. 2020), CellChat (Jin et al. 2021), scSeqComm (Baruzzo et al. 2022), NicheNet (Browaeys et al. 2020), CytoTalk, Domino (Cherry et al. 2021), CellCall (Zhang et al. 2021), scMLnet (Cheng et al. 2021), and PyMINEr (Tyler et al. 2019); and (2) L/R-target inference methods, including NicheNet (Browaeys et al. 2020), CytoTalk (Hu et al. 2021), scMLnet (Cheng et al. 2021), stMLnet (Cheng et al. 2022), MISTy (Tanevski et al. 2022), and HoloNet (Li et al. 2023a). A brief description for each of the above CCC inference methods is provided in Supplemental Text S1.
LR inference methods infer communication between cells or, more usually, cell types/clusters based on expression of known LR pairs from prior databases, whereas L/R-target inference methods predict downstream targets of LR interactions by considering intracellular signaling. Further details regarding the characteristics of these methods and the prior databases are presented in Supplemental Tables S1 and S2. The computational pipeline used by LR inference methods encompasses L/R scoring, LR scoring, and significance testing, which are summarized in Supplemental Text S2. Within the realm of L/R-target inference methods, NicheNet, scMLnet, and stMLnet use prior knowledge of intracellular signaling pathways from databases to infer cell-cell communication, whereas MISTy and HoloNet deduce regulatory relationships between intracellular target genes and ligands or receptors without taking regulatory pathways into account. In addition, most of the L/R-target inference methods require a predefined set of known target genes as input, whereas CytoTalk predicts de novo intracellular signaling components and targets directly from the data. Notably, a distinction should be made between the two terms L/R scoring and L/R-target: the former pertains to quantifying the activity level of ligands or receptors using expression data, whereas the latter concerns the regulation of target genes via ligand or receptor signaling.
Given that an increasing number of CCC inference methods have been developed and applied for downstream analysis of scRNA-seq or ST data to answer biological questions, guidelines are required to select and implement these tools. While a few previous papers have reviewed the characteristics, advantages, and disadvantages of these methods (Almet et al. 2021; Armingol et al. 2021; Jin and Ramos 2022) or assessed their prediction agreement (Dimitrov et al. 2022), a comprehensive benchmarking of the CCC inference methods is still lacking, which impedes the development of new methods and limits the practical applications of existing tools.
In this study, we designed a systematic benchmarking framework, ESICCC, for evaluating, selecting, and integrating CCC inference methods including 18 LR inference methods for predicting intercellular communications and five L/R-target inference methods for predicting intracellular signaling regulations. We quantitatively evaluated and compared their similarity, accuracy, stability, and usability using a total of 116 data sets, comprising 84 scRNA-seq data sets (sampled or original), 15 ST data sets, two sets of cell type–specific CAGE (cap analysis of gene expression) data and proteomics data, and 15 sets of cell line perturbation data. Moreover, we provide a practical guideline for tool selection and introduce an ensemble pipeline CCCbank for flexible integration of various methods and databases in CCC inference.
Results
Overview of the ESICCC framework
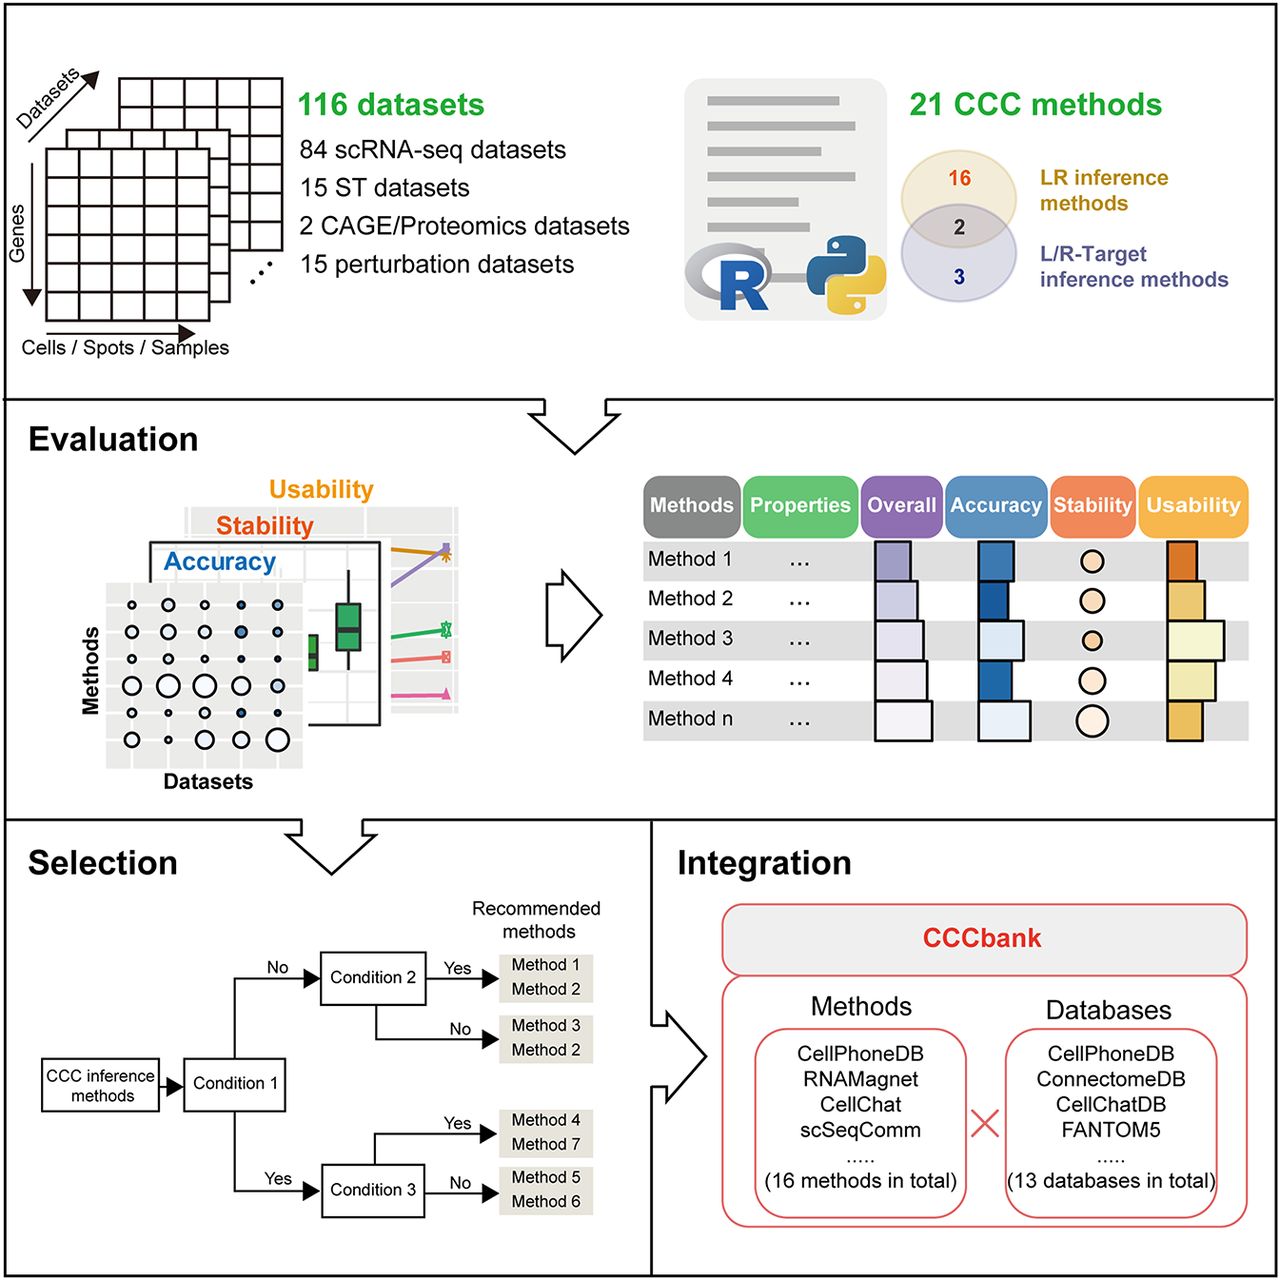
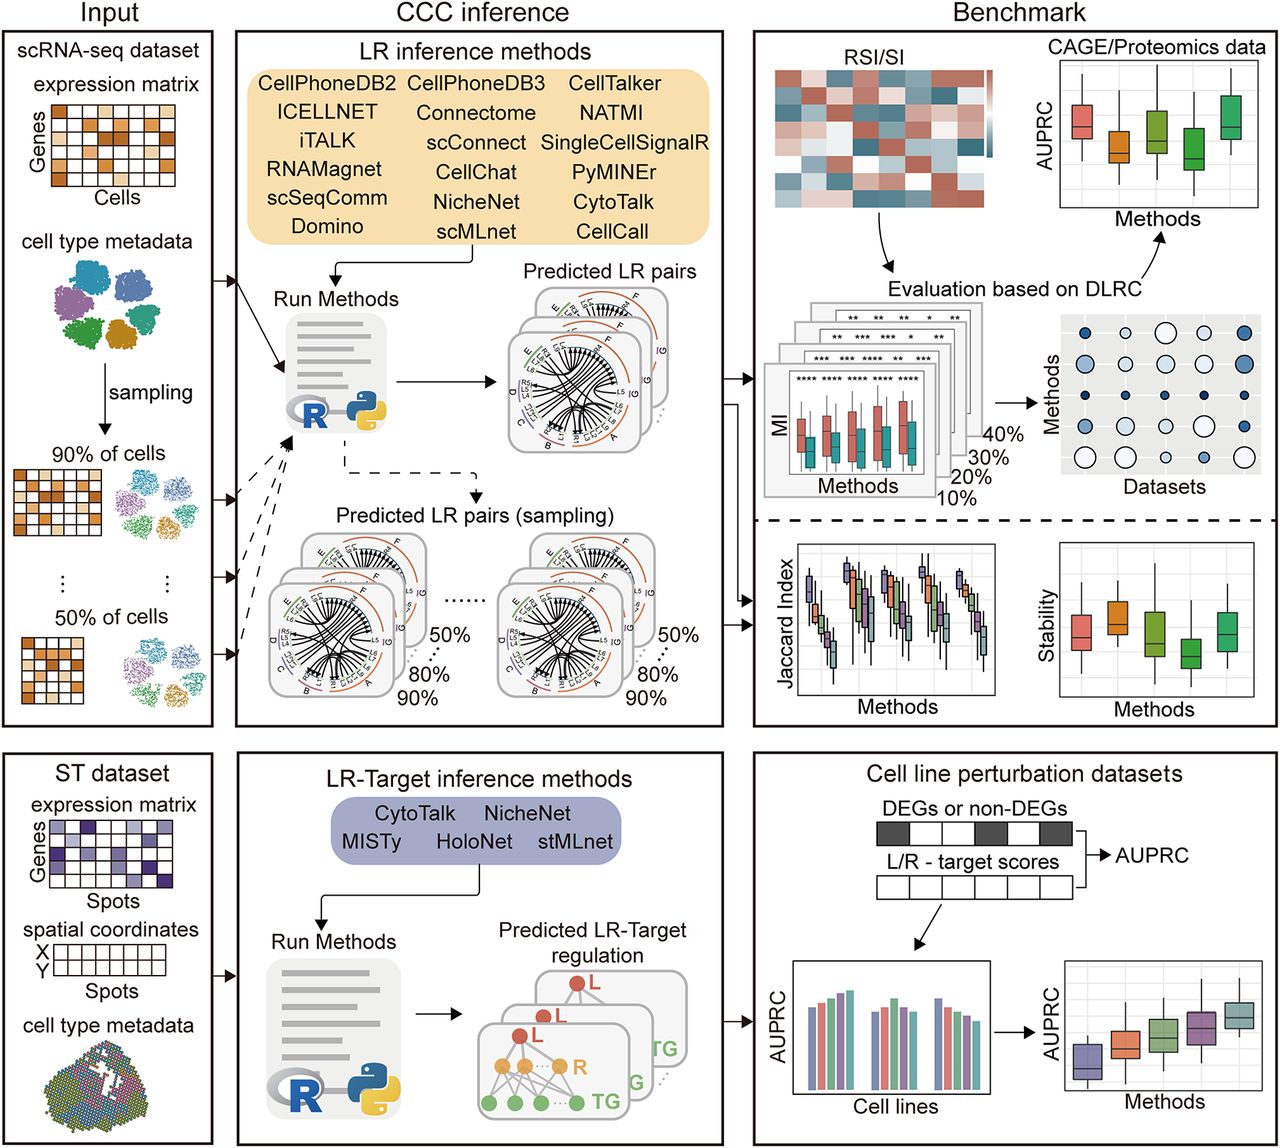
The ESICCC framework involves three components, i.e., evaluation, selection, and integration of CCC inference methods (Fig. 1). A benchmarking pipeline for the evaluation compartment is illustrated in Figure 2. First, we evaluated the overlap of the predicted LR pairs to assess the similarity of 18 LR inference methods. Then, we compared the methods based on an assumption that closer cell pairs have stronger LR associations. Eleven sets of scRNA-seq data were used as input for prediction and the matched 11 ST data sets were used for evaluation. Next, we used cell type–specific CAGE data and proteomics data as pseudogold standards to benchmark the 18 LR inference methods, each with three sets of scRNA-seq data of PBMC as input. Additionally, we evaluated the robustness of the 18 LR inference methods to variations in data size by sampling different ratios of cells in the aforementioned 14 scRNA-seq data sets. We also recorded and compared the running time and maximum memory usage of the 18 methods in all the data sets. The properties of the 18 LR inference methods are summarized in Figure 3A,B, and a summary table of benchmarks is listed in Figure 3C–F. Furthermore, we evaluated the prediction accuracy of five L/R-target inference methods, each with eight ST data sets as input and 15 sets of cell line perturbation-expression data as ground-truth. Based on the benchmarking results, we propose a practical guideline for users to easily choose scenario-specific CCC inference tools. At last, we develop an integrated pipeline that enables flexible combinations of methods and databases in CCC inference.
Overview of the ESICCC framework. It involves three components: evaluation, selection, and integration of CCC inference methods.
Benchmarking pipeline for evaluation and comparison of CCC inference methods. For benchmarking 18 LR inference methods, we used 11 scRNA-seq data sets as input and evaluated them from three aspects: similarity of the predicted LR interactions by each pair of methods, the differential LR correlations (DLRC) in close and distant cell pairs in 11 ST data sets, and the prediction accuracy (AUPRC) based on cell type–specific CAGE and proteomics data. We also calculated the Jaccard index to evaluate the robustness of each method to different sampling rates of cells in 14 scRNA-seq data sets. For benchmarking five L/R-target inference methods, we used eight ST data sets as input and evaluated the prediction accuracy (AUPRC) using 15 sets of cell line perturbation-expression data.
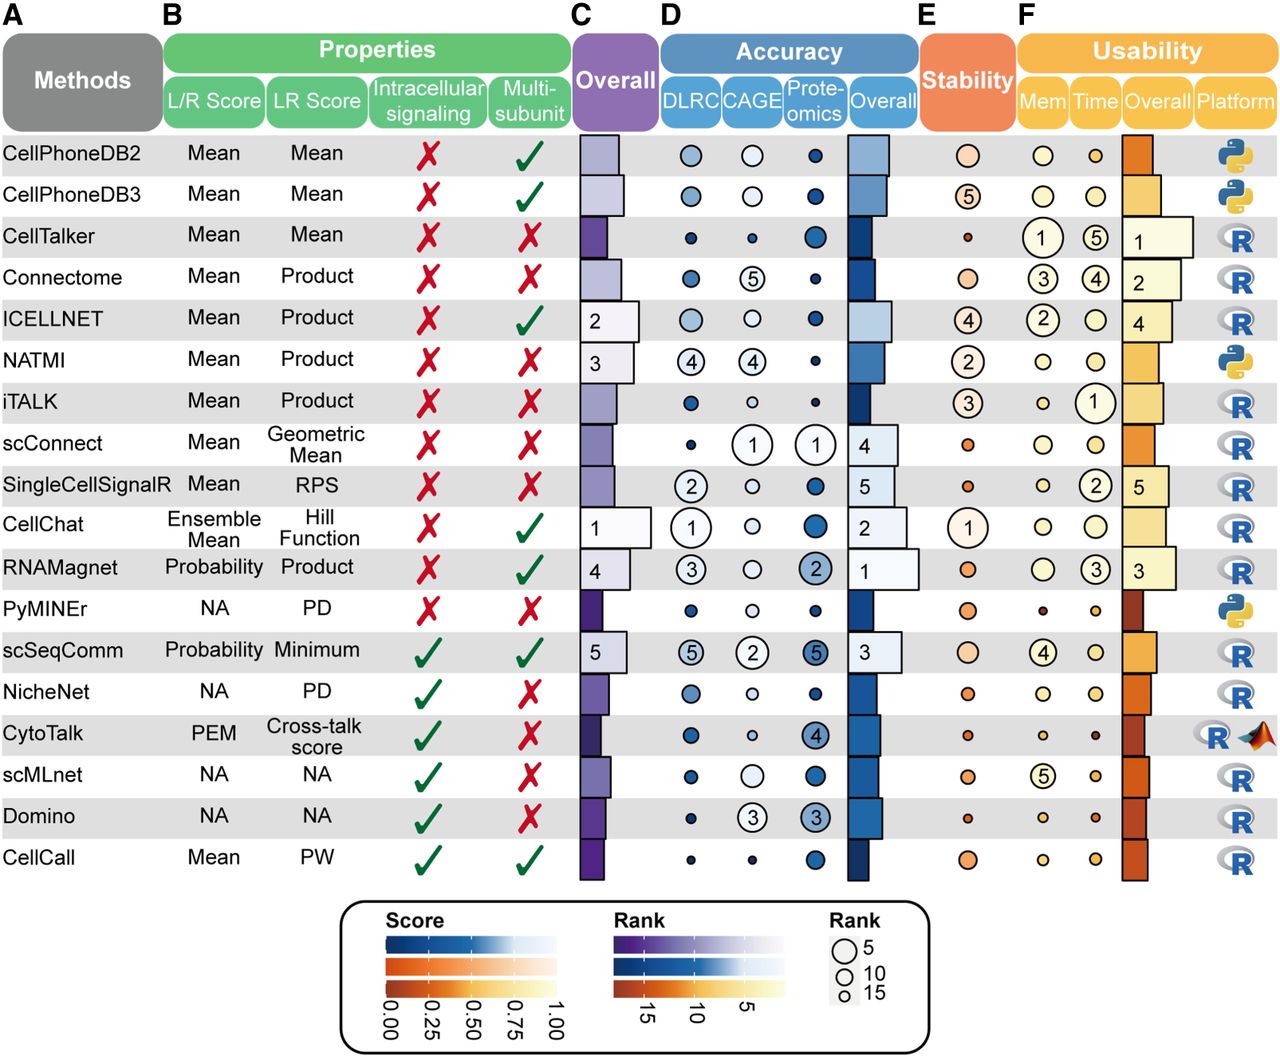
Summary of properties and benchmarking results for the 18 LR inference methods. (A) The names of the 18 LR inference methods. (B) Properties of the 18 LR inference methods. We listed the strategy of each method for L/R scoring, LR scoring, intracellular signaling consideration, and multisubunit L/R complexes consideration. NA, not applicable; PEM, preferential expression score; RPS, regularized product score; PD, prior databases of LR interactions; PW, pathway-based LR scores. (C–F) The overall ranking (C, violet), accuracy (D, blue), stability (E, orange), and usability (F, yellow), as well as programming language for each method, were evaluated and visualized.
Evaluation of similarity between 18 LR inference methods
We used 11 scRNA-seq data sets (Supplemental Table S3) as input data for the 18 LR inference methods to infer LR interactions between pairwise combinatorial cell types. For each method, we counted the number of predicted LR pairs of all cell cluster pairs, which are determined by significance test (P value < 0.05) or the default LR score cutoff in the method. To investigate the consistency of the overlapped LR interactions, we introduced a rank-based similarity index (RSI) to examine whether the overlapped LR interactions between two methods have a consistent ranking (according to their LR scores) (see Methods). The results indicated that their ranking was relatively consistent across most method pairs, as reflected by higher RSI values (Fig. 4A; Supplemental Fig. S1). Additionally, we found that some methods predicted a very large number of LR interactions (∼thousands), whereas others predicted a rather small amount of LR interactions (∼dozens). When using the classical Jaccard index, the values were extremely small and it was hard to observe the similarity or difference between different methods. Hence, we defined a similarity index (SI) based on the Jaccard index with modifications. Overall, the large variance in SI values indicated that the overlap of the predicted LR interactions between most of the methods was low (Fig. 4B; Supplemental Fig. S2). Together, considering SI and RSI metrics in a complementary manner could more comprehensively evaluate the similarity between different LR interaction inference methods.
Evaluation of the similarity between the 18 LR inference methods. (A) Heatmap of the aggregated rank-based similarity index (RSI) between each pair of the 18 methods over all data sets. (B) Heatmap of the aggregated similarity index (SI) between each pair of the 18 methods over all data sets.
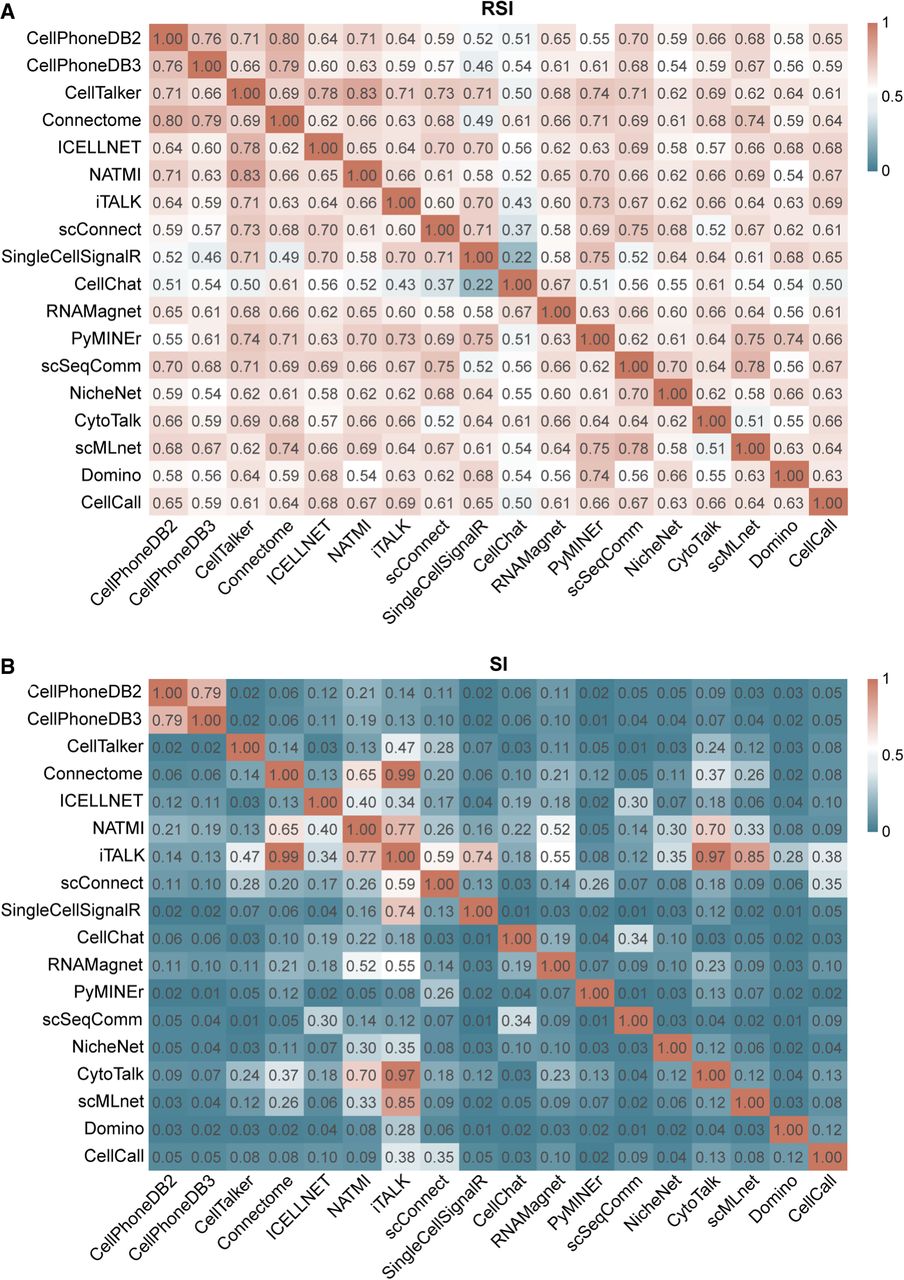
For instance, CellTalker and CellPhoneDB (v2.0 and v3.0) adopt different prior LR databases (Supplemental Table S2) but the same LR scoring algorithm. As such, the overlapped LR pairs between these two methods have a similar ranking (RSI≈70%), despite a low overlap fraction (SI = 2%). In contrast, Domino and CellPhoneDB (v2.0 and v3.0) adopt the same prior LR databases but different CCC inference algorithm, and their SI values are as low as 2%–3%, demonstrating the substantial role of algorithms in affecting LR interaction predictions. Additionally, we found that iTALK predicted a large amount of LR pairs that have a high overlap with those predicted by several other methods (e.g., Connectome, NATMI, SingleCellSignalR, CytoTalk, scMLnet), leading to large SI values between iTALK and these methods. Notably, CellChat had a rather smaller RSI (about 0.5 or less) than other methods, implying that the LR scoring algorithm used by CellChat assigns different ranks to LR interactions, compared to other methods.
Benchmarking 18 LR inference methods using differential LR correlations in ST data
We hypothesized that LR expression correlations should be greater in close cell pairs than in distant ones (Hu et al. 2021; Jin et al. 2021). Therefore, we used 11 ST data sets that are paired data sets with the abovementioned 11 scRNA-seq data sets, to evaluate the performance of the 18 methods based on the difference of mutual information (MI) of LR interactions in the close and distant cell groups (see Methods for details).
As expected, in the different data sets, the MI of LR interactions predicted by almost all methods in the close group were significantly higher than those in the distant group, as evaluated for the top 10% close/distant cell pairs (Supplemental Figs. S3–S7). Furthermore, we observed that the MI of LR interactions in the close group might no longer be significantly higher than those in the distant group, as the ratio of cell pairs in the close/distant group increased.
We calculated the DLRC (differential LR correlations) index (see Methods for details) to assess the difference of LR correlations in the close and distant cell groups for each method across the 11 ST data sets (Fig. 5A). Based on the ranking of the averaged DLRC index across all the data sets (scaled from 0 to 1) (Fig. 3D), CellChat, SingleCellSignalR, RNAMagnet, NATMI, and scSeqComm were the top five methods that performed best in this benchmarking. Specifically, CellChat achieved the top three rank in 7 out of 11 data sets, whereas SingleCellSignalR, RNAMagnet, and NATMI got top three rank in 5 out of 11 data sets; scSeqComm also performed well, achieving the top three rank in 4 out of 11 data sets and ranking 6–9 in most of the other data sets (Fig. 5A).
Evaluation and comparison of prediction accuracies of the 18 LR inference methods across different data sets in DLRC, CAGE, and proteomics benchmarks. (A) Bubble matrix of DLRC index values. The index of the methods in each data set was scaled from 0 to 1. (B) Bubble matrix of the median AUPRC value of the methods based on the CAGE data and proteomics data. The median AUPRC of the methods in each data set was scaled from 0 to 1.
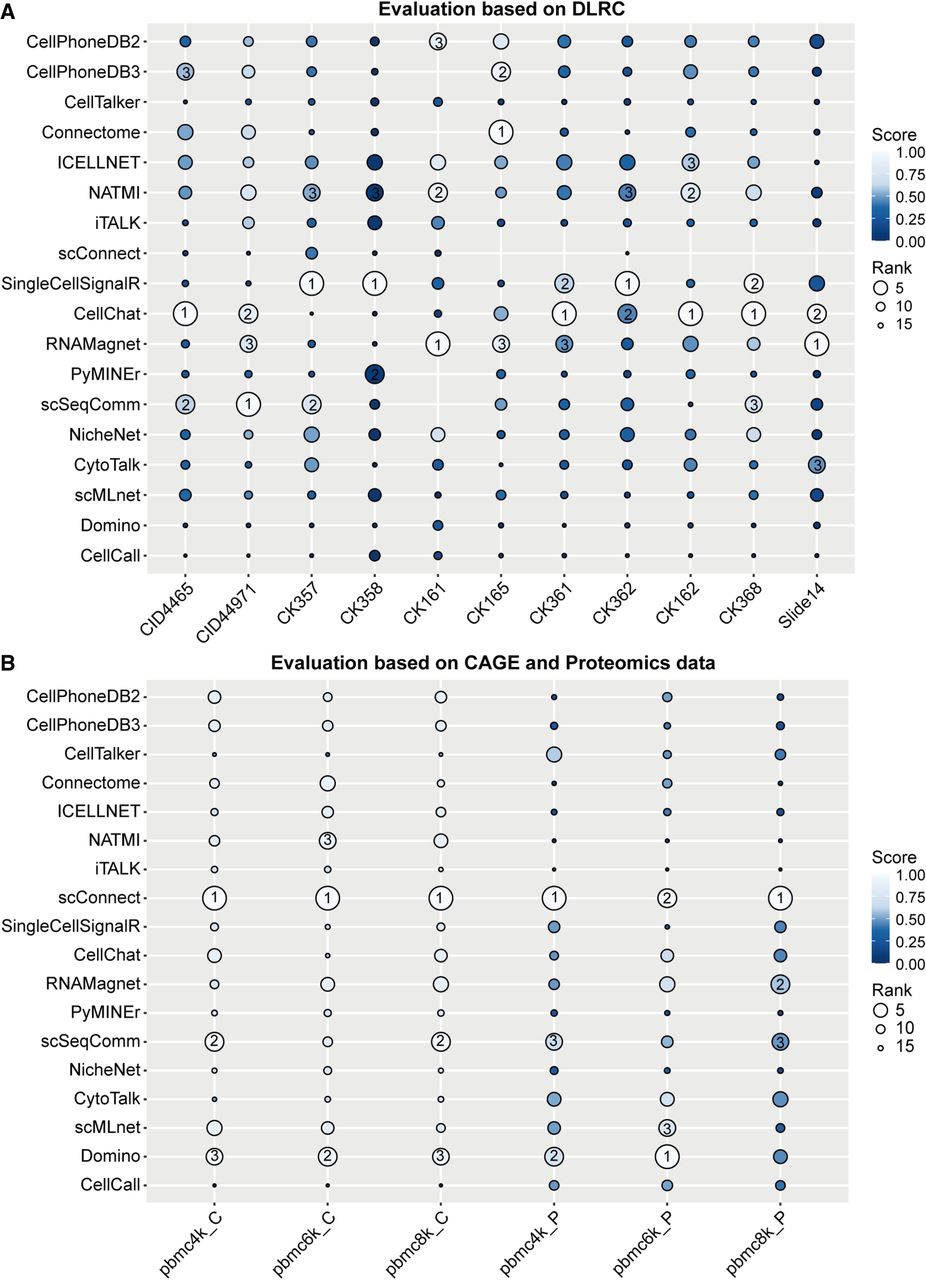
Following the ranking of the top five methods based on the DLRC index, there are eight methods (i.e., CellPhoneDB (v2 and v3), CellTalker, Connectome, ICELLNET, NATMI, iTALK, scConnect) that compute the L/R score as the average expression in the sender/receiver clusters. Among these eight methods, we found that the five methods (e.g., CellPhoneDB (v2 and v3), Connectome, ICELLNET, NATMI) that filter lowly expressed ligands/receptors often had a better performance than the other three methods.
Those methods (e.g., CellCall, NicheNet, CytoTalk, scMLnet, Domino) that consider intracellular signaling responses did not achieve a good ranking in this benchmarking, except for scSeqComm for which a high threshold of intercellular and intracellular score was set. These results imply that further efforts may need to be made in this direction to better dissect intracellular signaling pathways downstream from intercellular LR interactions.
Benchmarking 18 LR inference methods using CAGE and proteomics data
We used the CAGE data (expression in TPM) of 144 primary cell types (The FANTOM Consortium and the RIKEN PMI and CLST (DGT) 2014; Ramilowski et al. 2015) and proteomics data of 28 primary human hematopoietic cell populations in steady states (Rieckmann et al. 2017) as pseudogold standards to benchmark the above 18 methods. CAGE technology has the advantage of less dropouts and more accurate detection of cell type–specific gene expressions, whereas the proteomics data is valuable in verifying the LR interactions at the protein level. In the CAGE data, the LR interaction with the expressions of ligand and receptor in the respective cell types both >10 TPM was defined as a positive sample, otherwise as a false sample (Ramilowski et al. 2015). In the proteomics data, the LR interaction with the average counts of unique peptides of ligand and receptor greater than 2 was defined as a positive sample, otherwise as a negative sample (Deutsch et al. 2019). Three sets of scRNA-seq data of PBMC acquired from the 10x Genomics website (pbmc4k, pbmc6k, and pbmc8k) were used as input for each of the 18 methods to infer intercellular LR interactions. The prediction accuracy was evaluated using AUPRC (area under the precision recall curve) (see details in Methods), as we noticed an imbalance between positive and negative samples (Saito and Rehmsmeier 2015, 2017). Nonetheless, the results of AUROC (area under the ROC curve) were also provided in Supplemental Figures S8 and S9.
The benchmarking results on the CAGE data and proteomics data consistently revealed that scConnect, Domino, and scSeqComm are top-performing methods in terms of the accuracy for CCC inference (Fig. 3D). Specifically, these three methods received the most top three rankings in the six sets of evaluations: scConnect (6 of 6), Domino (5 of 6), and scSeqComm (4 of 6) (Fig. 5B). The above three methods performed significantly better than other methods in both CAGE benchmark (Fig. 6A,B) and proteomics benchmark (Fig. 6C,D).
Comparison of AUPRC values of different LR inference methods evaluated using CAGE and proteomics data sets. (A,C) Box plot of the AUPRC values of the methods across all CAGE data sets (A) and proteomics data sets (C). (B,D) Heatmap of statistical significance of difference of AUPRC values between different methods in the benchmarking based on CAGE data (B) and proteomics data (D). 1 represents that the AUPRC values of the method in row are significantly higher than those of the method in column (P < 0.05), otherwise for 0.
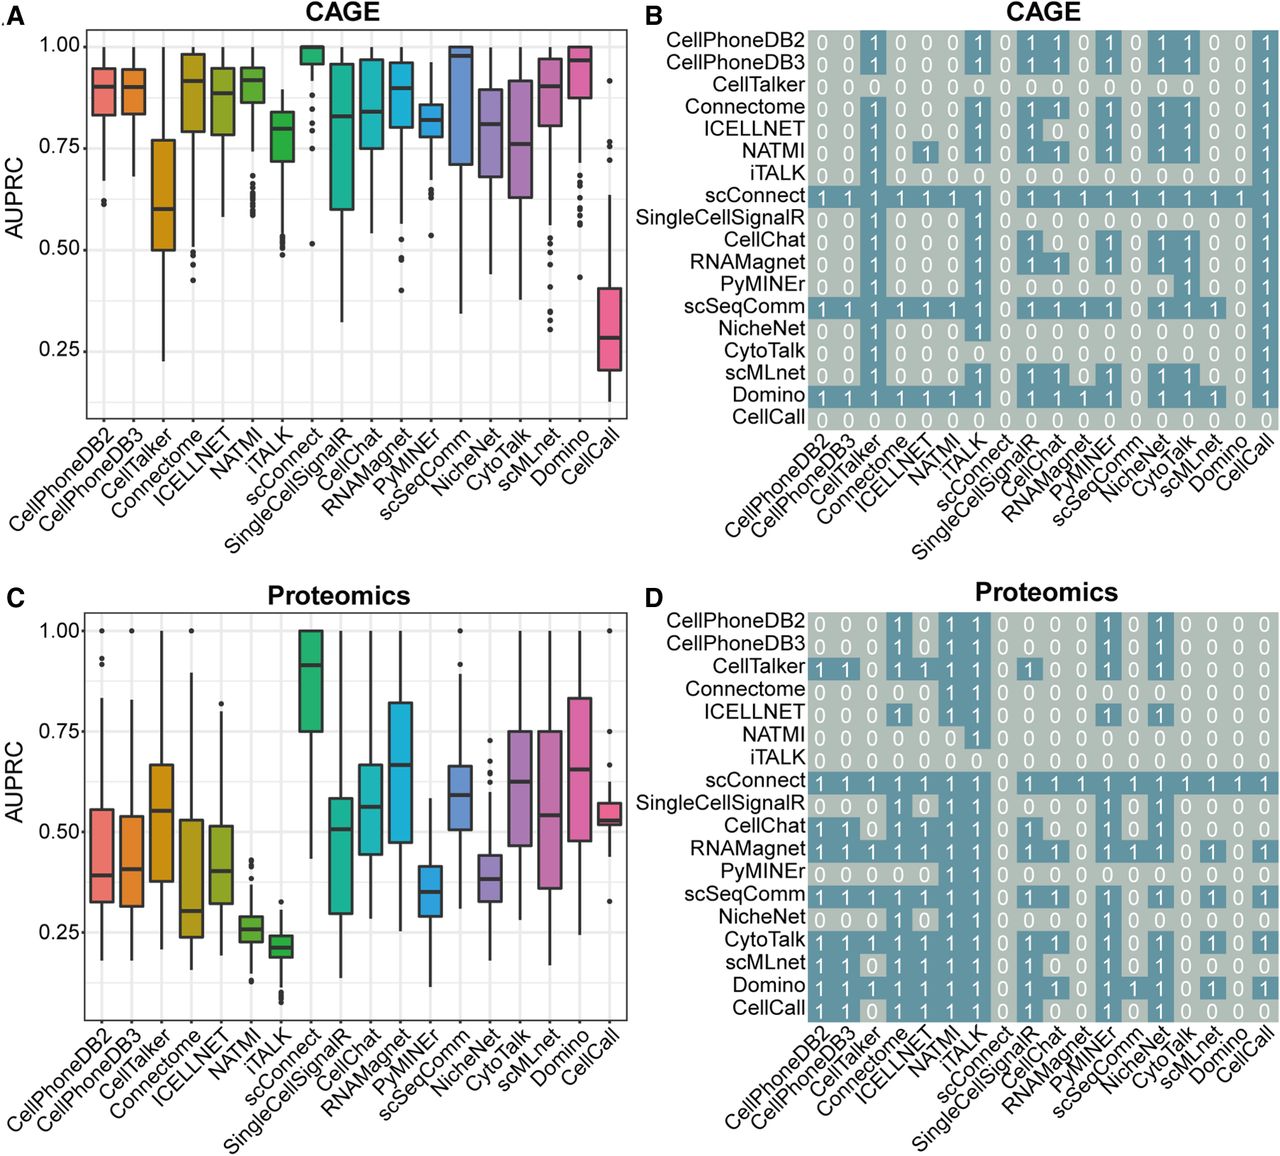
Moreover, we found that CellChat and RNAMagnet had better performance in the proteomics benchmark than in the CAGE benchmark. Specifically, in the proteomics benchmark, the AUPRC values of CellChat and RNAMagnet were significantly higher than most other LR inference methods (Fig. 6C,D).
To investigate the impact of different LR scoring methods on the CCC prediction accuracy, we compared CellPhoneDB (v2 and v3), CellTalker, Connectome, ICELLNET, NATMI, and iTALK. They all compute the ligands/receptors score as their average expression but use different LR scoring methods. Specifically, the last four methods compute LR score as the product of ligand score and receptor score, whereas CellPhoneDB (v2 and v3) and CellTalker compute LR score as the mean of ligand score and receptor score (Fig. 3B). We found that CellPhoneDB (v2 and v3) and CellTalker got significantly higher AUPRC than Connectome, NATMI, and iTALK in the proteomics benchmark (Fig. 6C,D). These results affirm that different LR scoring methods affect CCC prediction accuracy.
As previously mentioned, CellPhoneDB (v2 and v3) and CellTalker use the same LR scoring algorithm but different prior LR databases. Our analysis revealed that the AUPRC values of CellPhoneDB v2 and v3 and CellTalker were significantly different in the CAGE or proteomics benchmarks. These results indicate that the prior LR information is also important for CCC inference.
As for the methods that consider intracellular signaling responses, they had better performance in the proteomics benchmark than CAGE benchmark (Fig. 6B,D). Specifically, in the proteomics benchmark, the AUPRC values of most of the methods considering intracellular signaling responses were significantly higher than most other LR inference methods except for scConnect and RNAMagnet (Fig. 6D). These results are more optimistic than that in the DLRC benchmarks (Fig. 5A), in terms of the benefits of intracellular signaling consideration in CCC inference.
Robustness of 18 LR inference methods to data sampling
To test the robustness of the 18 LR inference methods to variability in the number of cells in different scRNA-seq data sets, we randomly sampled different ratios (i.e., 90%, 80%, 70%, 60%, 50%, respectively) of cells in the above 14 scRNA-seq data sets. The resulting 84 sets of scRNA-seq data in total were used as input for each method to predict LR interactions. The Jaccard index and stability value were calculated to evaluate the overlap between the inferred LR pairs from the sampled data sets and those from the original data sets (see Methods for details).
It was clearly shown that the Jaccard index decreased as the sampling ratio increased (Fig. 7A). For most methods, the median of the Jaccard index could reach above 0.75 at a 90% sampling ratio, and above 0.5 at a 50% sampling ratio. However, the Jaccard index of CellTalker was less than 0.25 at a 90% sampling ratio, and the Jaccard index values of scConnnect, SingleCellSignalR, CytoTalk, and Domino were less than 0.5 when sampling ratio was 60%. Consistently, CellTalker had the least stability (Fig. 7B).
Stability of the 18 LR inference methods to different sampling rates of the input scRNA-seq data. (A) Box plot of Jaccard index values between LR interactions predicted from the sampled data sets and those from the original data sets for each method. (B) Box plot of the overall stability values of each method. (C) Heatmap of statistical significance of difference of the overall stability values between different methods. 1 represents that the overall stability values of the method in row are significantly higher than those of the method in column (P < 0.05), otherwise for 0.
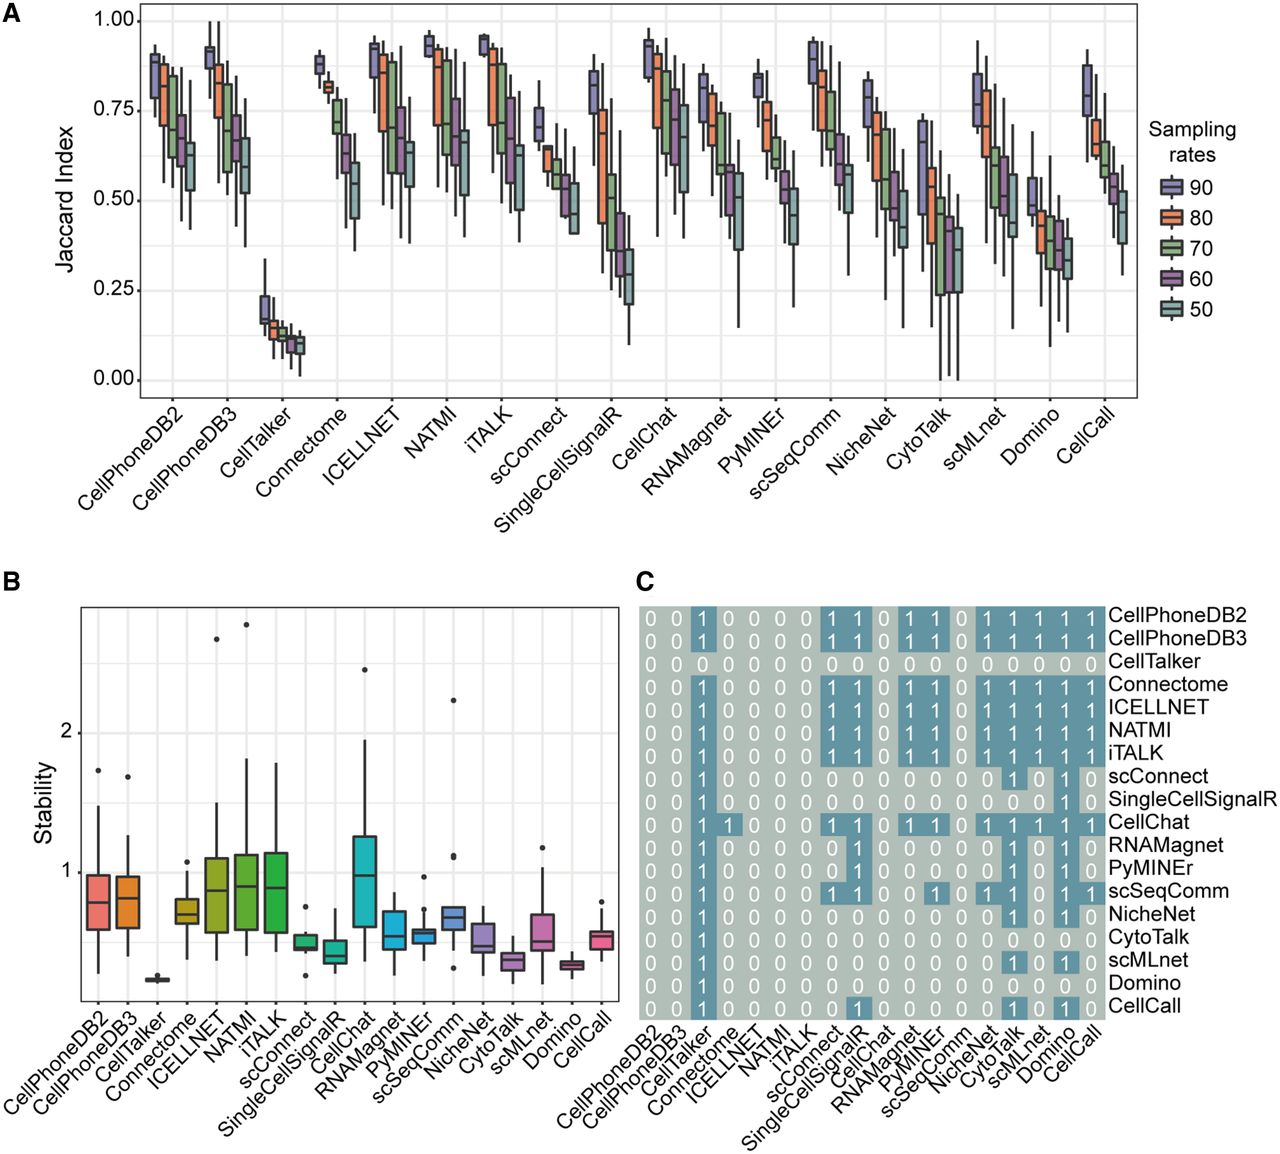
Overall, the top five ranked methods in the stability benchmarks were CellChat, NATMI, iTALK, ICELLNET, and CellPhoneDB v3 (Fig. 3E). In addition, we found that the stability values of most methods that solely consider LR interactions were significantly higher than those of methods that consider downstream signaling pathways (Fig. 7C). This might be because of the larger sensitivity of intracellular signaling responses to variations in cell number. Nevertheless, scSeqComm, with intracellular signaling score, had a compatible stability as the top-ranked methods (Fig. 7C).
Comparison of running time and memory usage between 18 LR inference methods
We then compared the running time and maximum memory usage of different methods recorded in all the 84 scRNA-seq data sets (Fig. 8). For the data sets with up to 20,000 cells, the running times of many methods (e.g., iTALK, SingleCellSignalR, RNAMagnet, CellTalker, CellChat, and Connectome) were within 20 min, whereas some methods (e.g., PyMINEr, NicheNet, CellPhoneDB v2, and CellCall) exceeded >1 h (Fig. 8A). CytoTalk required the longest running time (over hundreds of days) when the number of cells reached 10,000. As expected, methods that infer intracellular signaling took relatively longer to run than methods that infer intercellular communication only (Fig. 8A).
Running time and maximum memory usage of the 18 LR inference methods in all 14 scRNA-seq data sets. (A) Running time of the 18 methods across different data sets with the units of mins (top), hours (middle), and days (bottom). Data sets were ranked according to the number of cells in the ascending order. (B) Maximum memory usage of the 18 methods across different data sets. Data sets were ranked according to the number of cells in the ascending order.
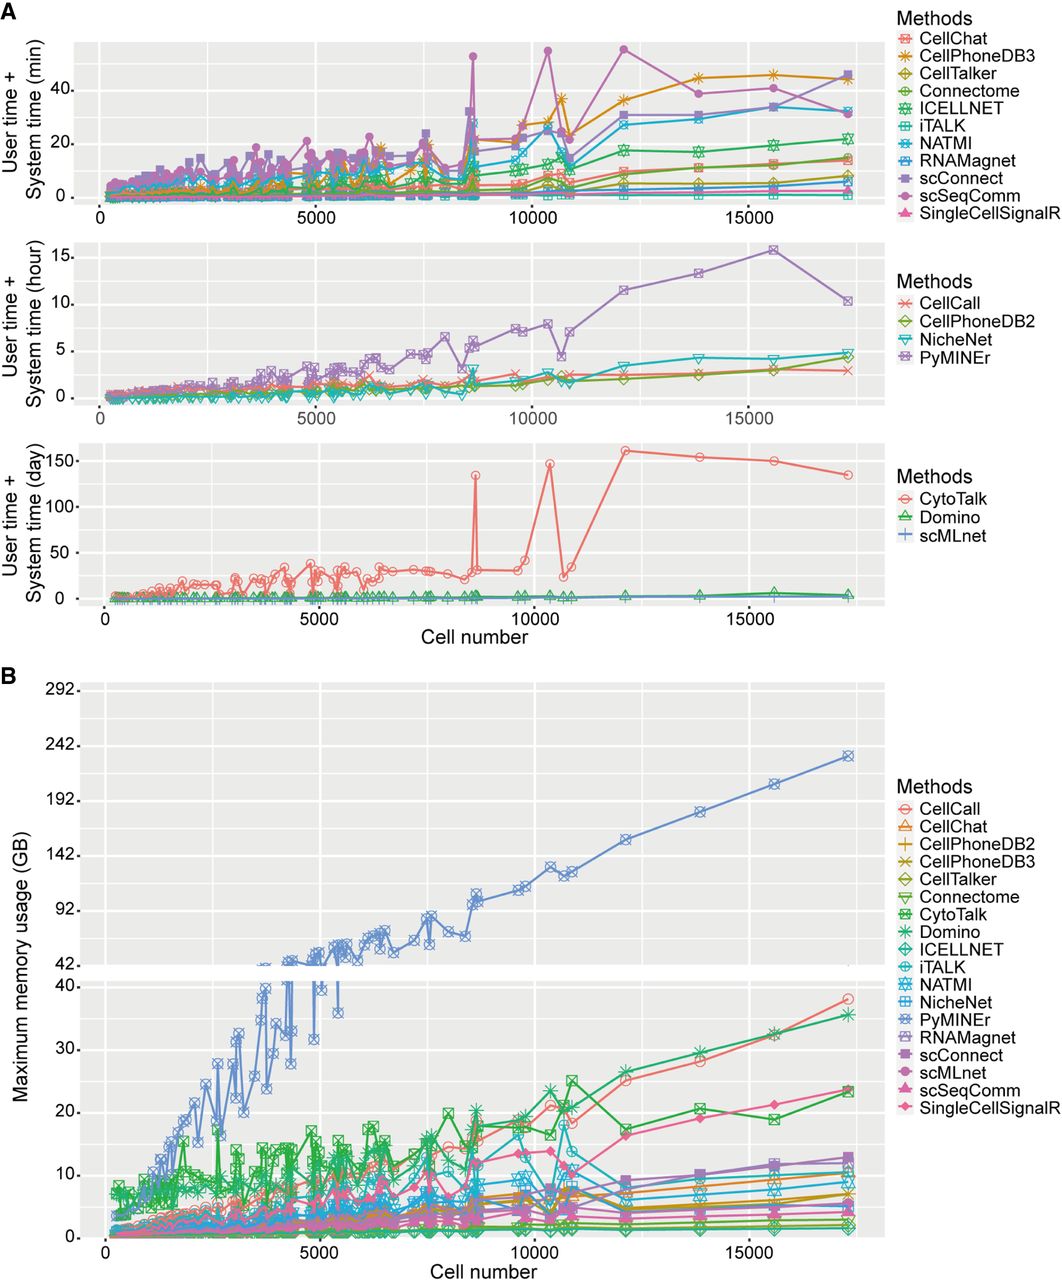
Furthermore, as the number of cells increased, the maximum memory usage of the above methods tended to increase (Fig. 8B). When the number of cells reached 20,000, the maximum memory usages of most methods were around 10 GB, whereas PyMINEr consumed up to 250 GB.
Benchmarking five L/R-target inference methods using perturbation data
We further evaluated and compared the five L/R-target inference methods, namely NicheNet (Browaeys et al. 2020), CytoTalk (Hu et al. 2021), stMLnet (Cheng et al. 2022), MISTy (Tanevski et al. 2022), and HoloNet (Li et al. 2023a). Note that scMLnet was not included in this comparison, as it does not provide L/R-target regulatory scores despite its capability to predict L-R-TF-Target paths. Because three of the five tools (i.e., stMLnet, MISTy, and HoloNet) require ST data as input, we used eight ST data sets of breast cancer, gliomas, and heart tissue as inputs for each method for prediction. For evaluation, we used the differentially expressed genes (DEGs) in the 15 expression data sets of cell lines of breast cancer, gliomas, TAM (tumor-associated macrophage), and cardiac fibroblasts with ligands or receptors being perturbed as ground-truth of L/R-targets (Supplemental Table S3). The AUPRC and AUROC values were calculated for evaluation (see details in Methods). We focused on the AUPRC values (Fig. 9A,B; Supplemental Fig. S10) and provided the AUROC results in Supplemental Figure S11, as the former is more informative than the latter when evaluating classifiers using imbalanced data sets (Saito and Rehmsmeier 2015, 2017).
Evaluation and comparison of five L/R-target inference methods using cell line perturbation-expression data sets. (A) Box plot of AUPRC values of each method across all combinations of the input ST data sets and perturbation-expression benchmark data sets. (B) Heatmap of statistical significance of difference of AUPRC values between each pair of two methods. Blue represents that the AUPRC values of the method in row are significantly higher than those of the method in column ([*] P ≤ 0.05, [**] P ≤ 0.01, [***] P ≤ 0.001, [ns] P > 0.05), otherwise for gray. (C) Line chart of running time (user time + system time) of the methods on different data sets. (D) Line chart of maximum memory usage of the methods on different data sets.
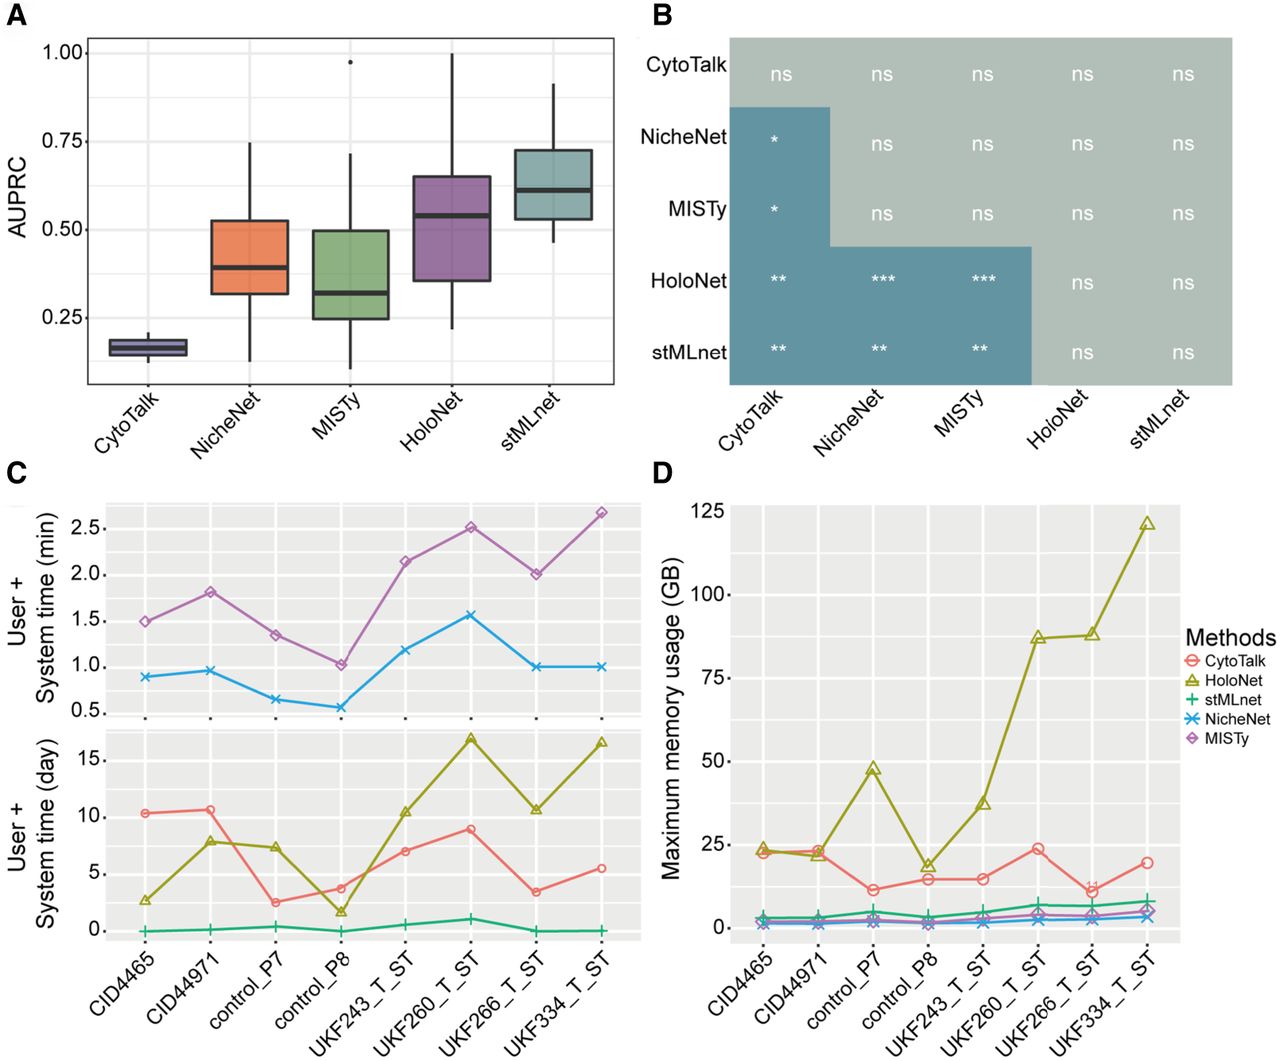
Among the five methods, CytoTalk and NicheNet were designed for CCC inference based on scRNA-seq data. CytoTalk could not predict the ligands or receptors of interest in the cell line perturbation data, except for DDL4 that was successfully predicted in CID44971 data set (Fig. 9A; Supplemental Fig. S10A). To speculate the ineffectiveness of CytoTalk in these predictions, we inspected the prize-collecting Steiner-Forest algorithm used by CytoTalk and we found that the preferential expression measure values, defined in CytoTalk, of most of the ligands/receptors of interest are negative, resulting in their node prizes being 0. As such, these nodes of ligands/receptors were filtered during the construction of signaling networks in CytoTalk. On the other hand, NicheNet predicted all ligands or receptors used in the perturbation experiments, and achieved a median AUPRC close to 0.4 (Fig. 9A). The incorporation of prior information of inter- and intracellular signaling interactions may help L/R-target prediction in NicheNet.
Overall, we found that both stMLnet and HoloNet had significantly higher AUPRC values than other methods, with no significant difference between the two (Fig. 9B). HoloNet performed well across most conditions (Supplemental Fig. S10), with median AUPRC value greater than 0.5. stMLnet achieved good prediction accuracy when it could predict out the concerned L/R signals, especially in CID44971 data set (Supplemental Fig. S10A), but it failed in some other conditions. An overall comparison between spatial modeling methods (i.e., stMLnet, MISTy, and HoloNet) and nonspatial modeling methods (i.e., CytoTalk and NicheNet) (Fig. 9A) suggests that incorporating spatial distance/relationships of interacting cells or molecules into CCC inference could improve the L/R-target predictions. Of note, although MISTy considers spatial relationships of molecules, it does not incorporate prior interaction information. As such, MISTy did not perform as good as stMLnet or HoloNet.
We also recorded the running time and maximum memory usage of the above five methods in all the data sets for comparison (Fig. 9C,D). We found that HoloNet and CytoTalk required longest running time (∼several days). MISTy, NicheNet, and stMLnet had a maximum memory usage below 10 GB, whereas HoloNet consumed much more memory than the other four methods.
Benchmarking summary
The overall benchmarking results are summarized in Figure 3, where we ranked the 18 LR inference methods according to the aggregated evaluation metrics over all the data sets (Supplemental Text S3). The overall accuracy of RNAMagnet, CellChat, and scSeqComm ranked in the top three among the 18 LR inference methods (Fig. 3D), according to the standardized and averaged score of DLRC accuracy, CAGE accuracy, and proteomics accuracy (Supplemental Text S3). Furthermore, the overall performances of CellChat, ICELLNET, and NATMI were ranked top three according to the aggregated score of accuracy, stability, and usability.
Our benchmarking study leads to some interesting and important findings. (1) LR scoring algorithm plays an important role in the prediction accuracy of the CCC inference methods. Overall, the methods using more advanced LR scoring algorithms showed better performances than other simple mean or product-based LR inference methods in terms of prediction accuracy. Specifically, as for top-ranked methods, RNAMagnet and scSeqComm use probability-based L/R scoring, and CellChat computes LR score using Hill function of ensemble average expression of L and R, whereas they all consider multisubunits of ligands or receptors. (2) The prior LR information is also important for CCC inference. Some tools (e.g., CellPhoneDB (v2 and v3) and CellTalker) use the same LR scoring algorithm but different prior LR databases and they have different performances on the DLRC benchmarks or CAGE and proteomics benchmarks. (3) As for L/R-target inference methods, stMLnet and HoloNet, which consider both spatial information and prior interaction knowledge, achieved higher prediction accuracy than the other three methods (NicheNet, CytoTalk, and MISTy).
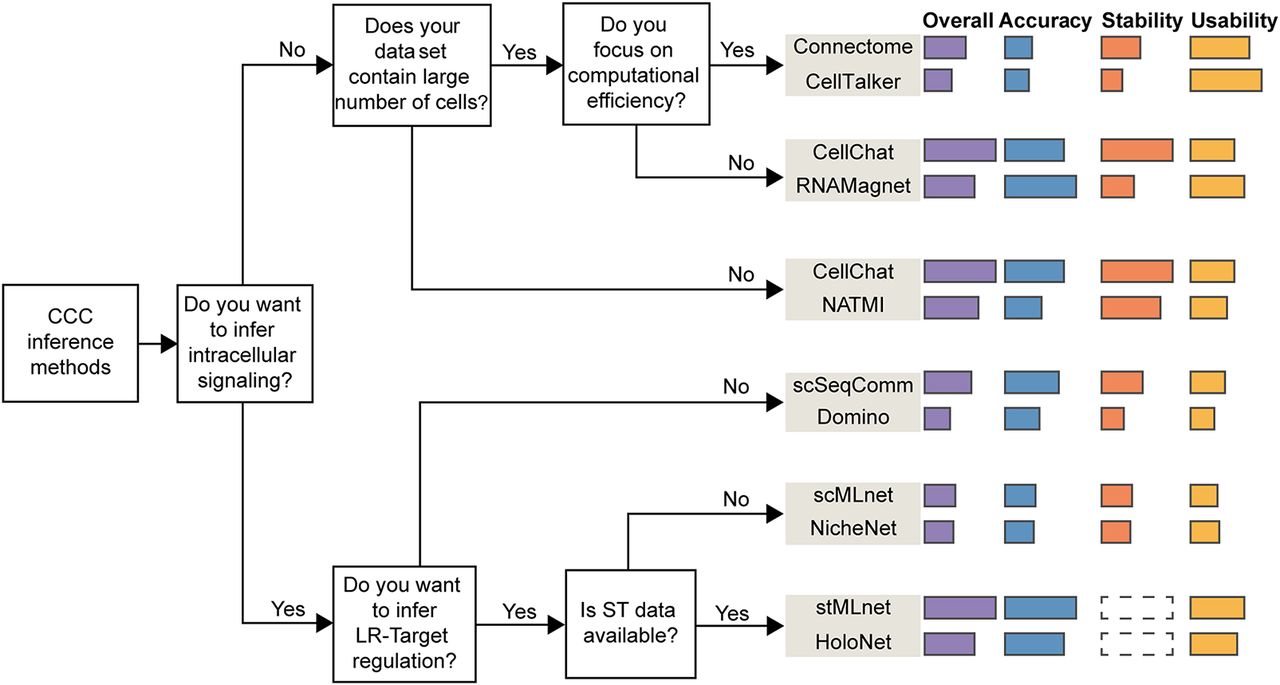
A decision-tree-based guideline of tool selection
Moreover, we provide a decision-tree-style recommendation of tool selection for users to easily choose the best method according to the data type and specific purposes (Fig. 10). For the analysis of intercellular LR interactions, CellChat or RNAMagnet is recommended because of their relatively good accuracy, and CellChat or NATMI is recommended if data sets in small size are used, whereas CellTalker or Connectome is recommended if the computational efficiency is concerned. For the purpose of inferring both inter- and intracellular signaling using scRNA-seq data, scSeqComm (with high cutoff), Domino, scMLnet, or NicheNet is recommended; note that the latter two tools can predict target genes downstream from the LR interactions, whereas the former two cannot. If ST data is available, we recommend stMLnet or HoloNet for L/R-target inference, as they have a higher prediction accuracy and the former can predict multilayer signaling, including TFs and target genes, making it feasible to perform functional enrichment analysis for CCCs.
Decision-tree-style recommendations for tool selection. Two tools are recommended for each common scenario. The relative rankings of accuracy, stability, usability, and overall performance of each recommended tool are listed. The wider the bar, the higher the ranking. The dashed box means unknown or unevaluated.
CCCbank: an ensemble pipeline for CCC inference
To facilitate practical utilization of CCC inference tools, we developed an integrated computational pipeline called CCCbank, which enables versatile combinations of 16 LR inference methods with 13 LR databases (see details in Methods) (Fig. 11A). Via CCCbank, each method can be equipped with one or more LR databases or any other user-defined databases. CCCbank uses Seurat object of scRNA-seq data as input for CCC inference. The output of CCCbank includes inferred LR pairs and their scores, which can be used for further analysis or visualization.
CCCbank as an ensemble pipeline for integrative CCC inference. (A) Illustration of CCCbank pipeline. (B) Comparison of performance changes in terms of overall accuracy for the three top-ranked methods (i.e., RNAMagnet, CellChat, and scSeqComm), each equipped with different databases. (C) Comparison of performances of different methods equipped with the same database, that is, CellChat or CellPhoneDB.
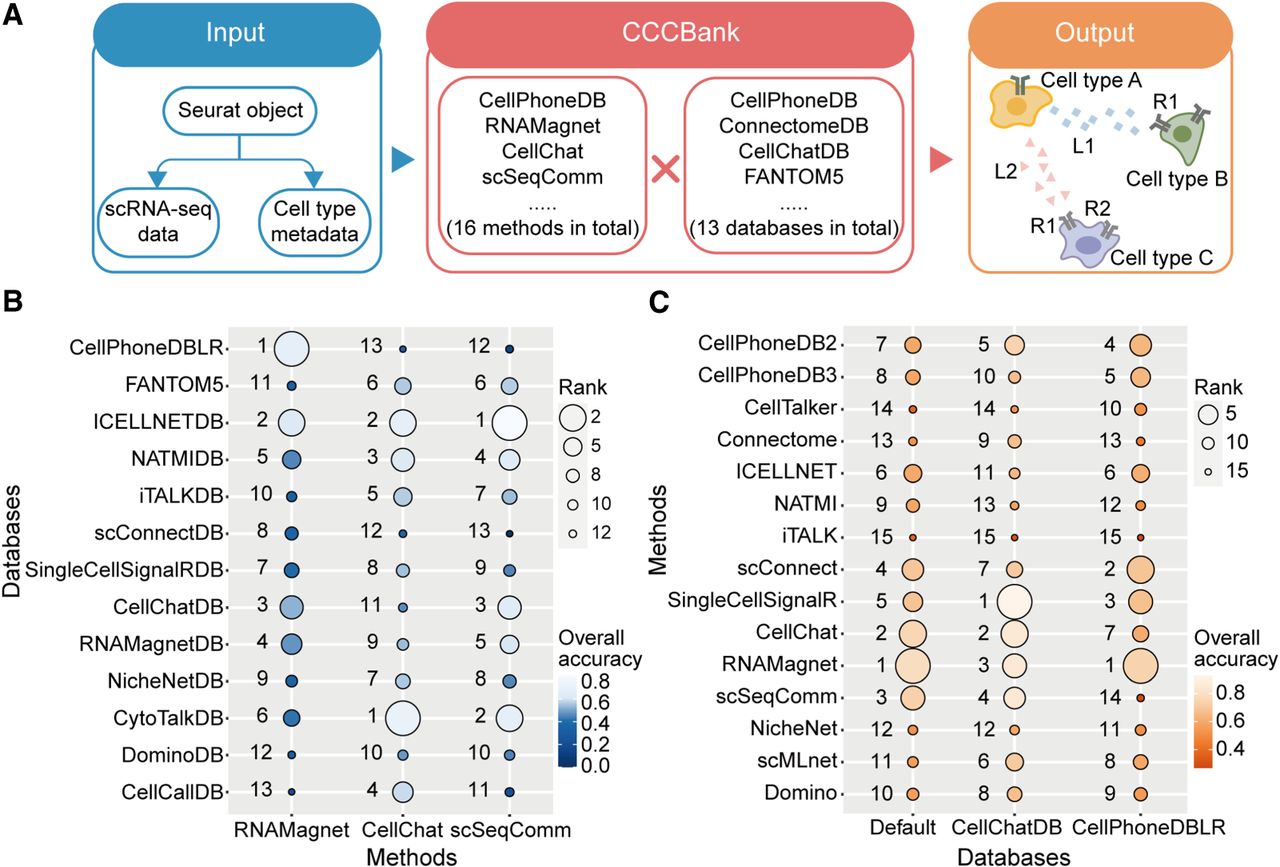
We here used CCCbank to examine the prediction accuracy of the top-performing methods (i.e., RNAMagnet, CellChat, and scSeqComm) combined with different databases. The results (Fig. 11B) show that, when combined with different databases, the same method had distinct performances in terms of overall accuracy. Specifically, the combination of RNAMagnet method with database CellPhoneDB, ICELLNETDB, or CellChatDB showed improved performance over its default database, whereas CellChat method and scSeqComm method performed better when combined with database ICELLNETDB or CytoTalkDB. These results suggest optimal combinations between databases and the top-performing methods, which have been implemented in CCCbank for better applications.
Lastly, we compared the performance of different methods equipped with the same database, i.e., CellChatDB or CellPhoneDBLR (Fig. 11C). CytoTalk method was not included in this comparison because its running time was too long (see also Fig. 8A). The results show that when the database was switched to CellChatDB, the overall accuracies of SingleCellSignalR, scMLnet, and Connectome were notably enhanced, whereas CellChat, RNAMagnet, and scSeqComm were still ranked as top-performing methods. When the database was switched to CellPhoneDBLR, the performances of scSeqComm and CellChat were relatively reduced, whereas the other methods had only subtle changes in their ranking with respect to overall accuracy.
Discussion
One of the major challenges in the development of CCC inference methodology is the lack of appropriate benchmarking. As a result, performances of CCC inference methods in terms of prediction accuracy, stability, and usability have not been comprehensively evaluated and compared, which significantly impedes the development, assessment, and application of CCC inference methods. To address this challenging gap, in this paper, we have proposed a systematic computational framework, ESICCC, for evaluating, selecting, and integrating CCC inference tools.
Compared to the existing comparison studies of CCC inference (Dimitrov et al. 2022; Liu et al. 2022), our study contains at least the following new contributions. (1) We introduced new metrics and benchmarks to comprehensively evaluate and compare the agreement, accuracy, stability, and scalability of the state-of-the-art CCC inference tools. Specifically, we defined RSI and SI for similarity measurement, and used DLRC, CAGE, and proteomics benchmarks for accuracy evaluation. (2) We designed a more comprehensive benchmarking pipeline that includes more tools and more data sets. We benchmarked 18 LR inference tools and five L/R-target inference tools using a total of 116 data sets. To the best of our knowledge, this is the first study to quantitatively benchmark computational methods for inferring L/R-target regulations from scRNA-seq data or ST data. (3) We proposed a decision-tree-style guideline for users to easily choose best tools for their specific research concerns considering intercellular or/and intracellular signaling inference, data type, data size, and computational efficiency. Furthermore, we developed an ensemble pipeline, CCCbank, that enables more comprehensive method/database combinations between 16 CCC inference methods and 13 pre-existing prior databases. Utilizing CCCbank, we compared performance of various combinations of LR inference methods and databases, empowering users to make informed decisions when selecting the optimal method/database combination for CCC inference. In addition, CCCbank enables users to implement a method with a combination of one or more prior databases in a complementary manner. (4) Moreover, our comparative results uncover several critical influential factors for CCC inference, such as prior interaction information, ligand-receptor scoring algorithm, intracellular signaling complexity, and spatial relationship, which may be considered in the future studies to advance the development of new methodologies.
In fact, besides the above methods, there are other CCC inference tools, to name a few, SoptSC (Wang et al. 2019a), SpaOTsc (Cang and Nie 2020), cell2cell (Armingol et al. 2022b), and Scriabin (Wilk et al. 2023), which are not included in this benchmarking study because of the following reasons. (1) SpaOTsc requires spatial imaging data along with scRNA-seq data as input. (2) SoptSC and SpaOTsc require a predefined pathway of interest for CCC inference. (3) cell2cell did not predict any LR interactions from the breast cancer data set. (4) Scriabin infers LR interactions at single-cell level, performs comparative analysis of cell pairs between conditions, and identifies modules of coexpressed LR pairs, which are hard to be validated via the cell type/cluster-level benchmarks used in this study. Furthermore, recently emerging ST-based LR inference methods (e.g., Giotto [Dries et al. 2021], stLearn [Pham et al. 2020], COMMOT [Cang et al. 2023], and SpatialDM [Li et al. 2023b]) may need independent benchmarking strategies in future studies. In addition, COMUNET (Solovey and Scialdone 2020), scTensor (Tsuyuzaki et al. 2019), and Tensor-cell2cell (Armingol et al. 2022a) are designed to identify communication patterns following CCC inference from scRNA-seq data, which are also beyond the scope of this study.
The hypothesis for the DLRC benchmark is motivated by the widely acknowledged assumption that closer cells are more likely to signal to each other and thus have stronger communication signaling, compared to distant cell pairs (Jin et al. 2021; Palla et al. 2022; Armingol et al. 2022b). Similarly, Dimitrov et al. (2022) assumed that “colocalized cell populations are expected to have a higher chance to interact with each other than other nonadjacent cell types”. Hu et al. (2021) also used mutual information to evaluate and validate the differential correlations of spatial expression of pathway genes inferred by CytoTalk across cell pairs in the close group and distant group. The DLRC approach in our study aims to evaluate whether the LR correlations are spatially enriched in the closer cell pairs compared to distant cell pairs, which is consistent with other works. For instance, scHOT (Ghazanfar et al. 2020) can be used to detect spatial enrichment of gene pairs that have significantly differential correlation in local region, compared to a general overall correlation. It has been shown that, as the spatial span of local space increases, the number of significant gene pairs inferred by scHOT would decrease (Extended Fig. 6D therein) (Ghazanfar et al. 2020). Moreover, we ran scHOT with different span parameters and found that the local correlations of the significant gene pairs would decrease and tend to zero as the spatial span increases (Supplemental Fig. S12). These observations are, to some extent, consistent with our hypothesis that the correlations of interacting LR pairs in the close groups should be higher than those in the distant groups.
The CAGE and proteomics data were used as pseudogold standards for benchmarking LR inference. It is worth noting that the cells in the CAGE and proteomics benchmarks are primary cells from the peripheral blood of human donors instead of cell lines. Actually, the 28 hematopoietic cell types in the proteomics data were sorted by flow cytometry from peripheral blood of healthy donors, and three or four repeat measurements were performed for each cell type; similarly, the CAGE data were obtained from 144 human primary cell samples (∼three donors for most cell types). The cell type–specific CAGE and proteomics data are suitable to be used for testing CCC inference because most of the existing methods infer LR interactions at cell type/cluster level; moreover, the sequencing depth of CAGE data is higher than that of scRNA-seq data, so the CAGE data are more reliable for detecting cell type–specific gene expression. In future studies, data sets generated from high-throughput screening technologies (e.g., phosphoproteomics [Tian 2014], Perturb-seq [Adamson et al. 2016], CRISP-seq [Jaitin et al. 2016]) may be used to extend the benchmarks for LR inference and L/R-target predictions. Additionally, synthetic data sets generated from large-scale spatial-temporal simulations can serve as a complementary method for benchmarking, as performed by a few previous studies (e.g., MISTy [Tanevski et al. 2022] and stMLnet [Cheng et al. 2022]) in which small-scale data sets have been generated.
Our benchmarking also implies several directions for developing new CCC inference methods. For example, we found that some LR inference methods considering intracellular signaling responses did not perform as well as expected, especially in the benchmarks of differential LR correlations in ST data, which might be because of complexity of the intracellular signal transduction networks. Existing CCC inference methods only use scRNA-seq data to infer TF-target gene interactions and TF activities, which may be far from enough. Epigenomics at single-cell resolution, such as scATAC-seq (Satpathy et al. 2019; Mimitou et al. 2021), should be useful for modeling multilayer signaling networks by inferring the intracellular gene regulatory networks (GRNs) that are regulated by upstream LR signals. As such, integrating scRNA-seq data and scATAC-seq data is anticipated to advance CCC inference and analysis. In addition, integrating the scRNA-seq data and ST data to infer CCC signaling networks can make full use of their advantages (Longo et al. 2021). Moreover, integrating single-cell or spatial transcriptomics with proteomics, such as CITE-seq (Stoeckius et al. 2017), can more accurately quantify intercellular LR signaling because the ligands and receptors act in their protein form. In future studies, multiscale models that can integrate single-cell multiomics data, such as scRNA-seq, ST, scATAC-seq, and/or single-cell proteomics, are expected to be developed for better inference of CCC signaling/regulation across multilayers.
Methods
Data sets used for benchmarking
To evaluate similarity of the predicted LR interactions and differential LR correlations in close and distant cell pair groups between the 18 methods, we have collected 11 data sets of scRNA-seq and 11 paired ST data sets (Wu et al. 2021; Kuppe et al. 2022) (including one ST data set at single-cell resolution [Srivatsan et al. 2021]) for CCC prediction and evaluation. The scRNA-seq data sets were used for LR prediction and the corresponding ST data sets for evaluation. The ST data set at single-cell resolution was used for both prediction (without spatial information) and evaluation (with spatial information). These data are acquired from different tissues, including heart tissue from healthy people, ICM patients and AMI patients, breast cancer tissue from TNBC patients and mouse embryo (E14). The detailed information of these data sets is listed in Supplemental Table S3.
To further benchmark the 18 LR inference methods, CAGE data (expression in TPM) of 144 primary cell types (The FANTOM Consortium and the RIKEN PMI and CLST (DGT) 2014; Ramilowski et al. 2015) and proteomics data of 28 primary human hematopoietic cell populations in steady states (Rieckmann et al. 2017) were collected and regarded as pseudogold standards of cell type–specific LR interactions. In such benchmarks, three sets of scRNA-seq data of PBMC downloaded from the 10x Genomics website (pbmc4k, pbmc6k and pbmc8k) were used as input for each of the 18 methods to infer intercellular LR interactions.
To evaluate L/R-target inference methods, eight ST data sets (Wu et al. 2021; Kuppe et al. 2022; Ravi et al. 2022) were used as input for each of the five tools. These ST data were acquired from heart tissues from healthy persons, tumor tissue from breast cancer patients or glioma patients. The detailed information of these ST data sets is listed in Supplemental Table S3.
Data preprocessing for the above scRNA-seq data sets and ST data sets, such as quality control, normalization, dimension reduction, clustering, and cell type annotation, was performed according to the description in their original studies (Srivatsan et al. 2021; Wu et al. 2021; Kuppe et al. 2022; Ravi et al. 2022). Deconvolution for ST data sets was performed using Cell2Location (Kleshchevnikov et al. 2022), one of the top-ranked ST deconvolution methods according to previous benchmarking studies (Li et al. 2022; Yan and Sun 2023). Parameter settings of the 18 LR inference methods and the five L/R-target inference methods in the benchmarking are described in Supplemental Texts S4 and S5.
Similarity of the predicted LR interactions between 18 LR inference methods
To examine whether the overlapped LR interactions between different methods have a similar ranking among all LR pairs predicted by each method, we defined a rank-based similarity index (RSI) as follows:
In addition, we defined the following similarity index (SI) to examine the overlapping fraction between two sets of predicted LR interactions:
Evaluating differential LR correlation in close and distant cell pairs based on ST data
We hypothesized that LR expression correlations in close cell pairs may be greater than those in distant cell pairs (Hu et al. 2021; Jin et al. 2021). So, we firstly used scRNA-seq data sets as input for the aforementioned 18 methods to infer LR interactions of all pairs of cell clusters, and then used the matched ST data sets to compare the performance of the 18 methods by evaluating the difference of correlations of LR pairs in the group of close cell pairs and distant cell pairs.
For each pair of cell clusters, all the spots/cells belonging to the sender cluster and all the spots/cells belonging to the receiver cluster in the ST data were used to construct the sender-receiver cell pairs. The sender-receiver cell pairs were divided into close and distant groups based on the Euclidean distance. Specifically, we constructed sender-receiver cell pairs by pairing each sender cell to all receiver cells. We denoted Si and Rj as the ith sender cell and jth receiver cell, respectively. Si – Rj represents the sender-receiver cell pair constituted by the ith sender cell and jth receiver cell. As such, the sender-receiver cell pairs are as follows:
We used MI to assess the correlation between ligand and receptor in each LR interaction inferred by different tools in the close or distant group. For instance, in the close group, the MI of an LR interaction was calculated based on the expression values of the ligand and receptor in the close sender-receiver cell pairs. Similarly, in the distant group, the MI of an LR interaction was calculated based on the expression values of the ligand and receptor in the distant sender-receiver cell pairs. If multisubunits of the ligand or receptor were involved in an LR interaction (e.g., that predicted by CellPhoneDB or CellChat), the MI of the LR interaction was calculated for each subunit. For all inferred LR interactions, the MI values of LR pairs in the close and distant groups were compared. MI was calculated in R v 4.0.5 (R Core Team 2021) using the mutinformation function in the infotheo 1.2.0 package (Meyer 2008). The statistical significance of the difference of LR correlations in the close and distant groups was assessed using a Wilcoxon rank-sum test.
Moreover, to comprehensively account for the difference of MI, the statistical significance, and different proportions of cell pairs in close/distant groups, we defined an evaluation metric, called DLRC (differential LR correlations) index, to assess differential LR correlations for each method in the ST data:
Evaluating the predicted LR interactions using CAGE and proteomics data
Since the proteomics data and CAGE data can detect the cell type–specific expression at protein level and promoter level, it may be a good choice to use them as pseudogold standards to evaluate the predicted LR interactions. The CAGE data of 144 human primary cell types generated by FANTOM5 project (The FANTOM Consortium and the RIKEN PMI and CLST (DGT) 2014; Ramilowski et al. 2015) were used in the CAGE benchmark. In the previous study (Ramilowski et al. 2015), it has been verified that under the threshold of 10 TPM, the true-positive rate of LR inference could achieve 82%, and the false-negative rate was only 4%; although the true-positive rate increased with larger threshold values, a lot of true positives would be lost at the same time. As such, the threshold of 10 TPM is more conservative for dissecting LR pairs based on the CAGE data (Ramilowski et al. 2015). Therefore, in our benchmark, if the CAGE expressions of ligand in sender cell type and receptor in receiver cell type are both >10 TPM, this LR pair will be considered as truly existing in the sender-receiver cell types, labeled as a positive sample. Otherwise, this LR interaction will be viewed as not existing, labeled as a negative sample.
As for the proteomics benchmark, the quantitative, high-resolution mass spectrometry (MS) technology was used to detect the proteomics for each of the 28 hematopoietic cell types that were sorted by flow cytometry from peripheral blood of healthy donors (Rieckmann et al. 2017). The MS data can be used for protein characterization and quantification. In our benchmark, we used the proteomics data to characterize the presence of the ligand protein and the receptor protein in each LR pair. If the ligand protein and the receptor protein are both present in the proteomics data, then we consider that the corresponding LR interaction should exist. According to Human Proteome Project Mass Spectrometry Data Interpretation Guidelines 3.0 (Deutsch et al. 2019), a protein is characterized to be present when the count of unique peptides of the protein is greater than 2 in the MS data. Therefore, in our proteomics benchmark we used two unique peptides as a threshold for the ligand protein and the receptor protein to define the ground-truth of the LR interaction, similar to Cabello-Aguilar et al. (2020).
Three sets of scRNA-seq data of PBMC that have been downloaded from the 10x Genomics website (4 k, 6 k, 8 k human PBMCs) were used as input for various CCC inference methods for prediction, and cell type–specific expressed LR pairs based on CAGE and proteomics data were used as pseudogold standards for benchmark. AUROC and AUPRC were calculated for evaluation. The statistical significance of difference in AUROC or AUPRC values between each pair of two methods was assessed using Wilcoxon rank-sum test.
We admit that the high coexpression or coabundance of ligand and receptor does not guarantee a functional interaction, but because those ligands and receptors are known to interact for at least one combination of cell types because of prior knowledge as deposited in molecular interaction databases, we considered that the above benchmarks are sufficiently reasonable for our purpose.
Evaluating the robustness of methods to sampling rates of scRNA-seq data
Considering large variations of samples of cells in different scRNA-seq data sets, it is important to investigate robustness of each method to the size of input data set. We evaluated and compared the robustness of all methods to different sampling rates (e.g., 90%, 80%, 70%, 60%, 50%) of cells in each of the above 14 data sets of scRNA-seq data. The resulting 84 data sets, including 70 sampled data sets and 14 original data sets, were used as input for each method to predict LR interactions. Jaccard index was used to evaluate the similarity of predicted LR interactions in the sampled data sets with those in the original data sets:
To compare the stabilities of different methods more intuitively, we calculated a stability value (S) for each method as follows:
Benchmarking L/R-target inference methods
To benchmark the L/R-target inference methods, we collected 15 perturbation-expression data sets of cell lines of breast cancer, gliomas, and cardiac fibroblasts with ligands or receptors being perturbed. The information for perturbation-expression data sets is listed in Supplemental Table S4. The DEGs in each of the 15 perturbation-expression data sets (before vs after perturbation) were selected using limma 3.46.0 package (Ritchie et al. 2015) in R v 4.0.5 (R Core Team 2021). The significant DEGs, with P value less than 0.05, were used as ground-truth of L/R-targets for evaluation. Specifically, the L/R-target was labeled as true if the predicted target gene is a DEG, otherwise it was labeled as false. The regulatory scores of ligand/receptor-targets predicted by each tool were compared to the ground-truth labels to calculate AUPRC as well as AUROC using ROCR 1.0-11 package (Sing et al. 2005) in R v 4.0.5 (R Core Team 2021).
Since three tools (i.e., stMLnet, MISTy, and HoloNet) require ST data as input, we used eight ST data sets of breast cancer, gliomas, and heart tissue as input data for each method for prediction (Supplemental Table S2). Additionally, because most of the L/R-target inference methods, except CytoTalk, require a set of predefined targets of interest as input as described above, so we used interaction-changed genes (i.e., ICGs) (Dries et al. 2021) as such input for each method for comparison purposes.
As for the ST data set of breast cancer, we set breast cancer cells as receiver cell types and others as sender cell types to infer the L/R-target regulations. Meanwhile, the 10 perturbation-expression data sets of breast cancer cell lines were used for evaluation, involving knockout/mutant conditions for three receptors (i.e., AXL, NRP1, CXCR4) and treatment conditions for five ligands (i.e., CXCL12, TGFB1, DLL4, JAG1, and IGF1).
As for the ST data set of glioma, two perturbation-expression data sets with inhibition conditions for two receptors (i.e., FGFR1 and CSF1R) were used for evaluation. As the FGFR1-perturbation data set is for glioma cells, we used glioma cells as receiver cell types and other cell types as senders to infer the L/R-target regulations from the ST data. Whereas the CSF1R-perturbation data set is for macrophages, so we set macrophages as receiver cell types and others as sender cell types to infer the L/R-target regulations from the ST data.
As for the ST data set of heart tissue, we set cardiac fibroblasts as receiver cell types and others as sender cell types to infer the L/R-target regulations. The three perturbation-expression data sets of cardiac fibroblasts were used for evaluation, involving treatment conditions for two ligands (i.e., EFNB2 and TGFB1). Of note, in the NCBI Gene Expression Omnibus (GEO; https://www.ncbi.nlm.nih.gov/geo/) data set under accession number GSE123018, cardiac fibroblasts from patients undergoing coronary artery bypass grafting were treated with TGFB1 after 45 min, 2 h, 6 h, and 24 h and then subjected to RNA sequencing. As such, we made four comparisons between the four treatment groups and the control group (before TFGB1 treatment), respectively, to select DEGs for each condition.
Comparison of running time and max memory usage for different methods
In the benchmarks for the 18 LR inference methods, we recorded running time and maximum memory usage for each method across the 84 data sets (with or without sampling). In the benchmarks for the five LR-target inference methods, we recorded running time and maximum memory usage for each tool on eight ST data sets. We used the time command line in Linux to record running time (user time + system time) and maximum memory usage for each method on each data set. We scored the running time and maximum memory usage to calculate the usability for each method (Supplemental Table S5).
Methods and databases included in CCCbank
We developed an R package, CCCbank, as an ensemble pipeline to implement flexible combinations between different CCC inference methods and databases. CCCbank contains 16 LR inference methods (CellPhoneDB v2.0, CellPhoneDB v3.0, CellTalker, Connectome, ICELLNET, NATMI, iTALK, scConnect, SingleCellSignalR, RNAMagnet, CellChat, scSeqComm, NicheNet, CytoTalk, Domino, scMLnet) and 13 LR databases (CellPhoneDBLR, FANTOM5, ICELLNETDB, NATMIDB, iTALKDB, scConnectDB, SingleCellSignalRDB, CellChatDB, RNAMagnetDB, NicheNetDB, CytoTalkDB, DominoDB, CellCallDB).
Two methods, CellCall and PyMINEr, were not included in CCCbank because of the following reasons. CellCall requires L-R-TF links as its prior database as such that it is not feasible to equip CellCall with other LR databases. PyMINEr uses protein-protein interactions (PPIs) as its prior database and it is hard to be changed to other LR databases. Therefore, CCCbank encompasses 16 methods in total.
The databases used by CellPhoneDB v2 and CellPhoneDB v3 are the same (i.e., CellPhoneDB). In CCCbank, only the LR pairs in CellPhoneDB were retained for LR inference and the PPIs were removed; the resulting database is called CellPhoneDBLR. Similarly, because PyMINEr database deposits PPIs rather than LR pairs, it was not included in CCCbank. In addition, CellChatDB is also used as prior database of scSeqComm, and the same LR database FANTOM5 is used by CellTalker, Connectome, and scMLnet. Therefore, CCCbank encompasses 13 databases in total.
Software availability
The source codes of ESICCC are available as Supplemental Source_Code_ESICCC and at GitHub (https://github.com/SunXQlab/ESICCC). An R package of CCCbank is also available as Supplemental Source_Code_CCCbank and at GitHub (https://github.com/SunXQlab/CCCbank).
Competing interest statement
The authors declare no competing interests.
Acknowledgments
We would like to acknowledge Professor Lei Wei at Tsinghua University as well as members in the Sun lab at SYSU for valuable discussions. This work was supported by grants from the National Key R&D Program of China (2021YFF1200903), the National Natural Science Foundation of China (62273364, 11931019, 11871070), the Guangdong Basic and Applied Basic Research Foundation (2020B1515020047), and Fundamental Research Funds for the Central Universities, Sun Yat-sen University (231lgbj025).
Author contributions: J.L. conducted survey, performed experiments, and wrote the draft. M.D. and X.Z. participated in discussion and results interpretation. X.S. conceived the study, designed experiments, and wrote the paper. All the authors have proofread and approved the manuscript.
Notes
[1] Supplementary material [Supplemental material is available for this article.]
[2] Article published online before print. Article, supplemental material, and publication date are at https://www.genome.org/cgi/doi/10.1101/gr.278001.123.
[3] Freely available online through the Genome Research Open Access option.
References
- ↵Adamson B, Norman TM, Jost M, Cho MY, Nuñez JK, Chen Y, Villalta JE, Gilbert LA, Horlbeck MA, Hein MY, 2016. A multiplexed single-cell CRISPR screening platform enables systematic dissection of the unfolded protein response. Cell 167: 1867–1882.e21. 10.1016/j.cell.2016.11.048
- ↵Almet AA, Cang Z, Jin S, Nie Q. 2021. The landscape of cell-cell communication through single-cell transcriptomics. Curr Opin Syst Biol 26: 12–23. 10.1016/j.coisb.2021.03.007
- ↵Armingol E, Officer A, Harismendy O, Lewis NE. 2021. Deciphering cell-cell interactions and communication from gene expression. Nat Rev Genet 22: 71–88. 10.1038/s41576-020-00292-x
- ↵Armingol E, Baghdassarian HM, Martino C, Perez-Lopez A, Aamodt C, Knight R, Lewis NE. 2022a. Context-aware deconvolution of cell–cell communication with Tensor-cell2cell. Nat Commun 13: 3665. 10.1038/s41467-022-31369-2
- ↵Armingol E, Ghaddar A, Joshi CJ, Baghdassarian H, Shamie I, Chan J, Her HL, Berhanu S, Dar A, Rodriguez-Armstrong F, 2022b. Inferring a spatial code of cell-cell interactions across a whole animal body. PLoS Computat Biol 18: e1010715. 10.1371/journal.pcbi.1010715
- ↵Baccin C, Al-Sabah J, Velten L, Helbling PM, Grünschläger F, Hernández-Malmierca P, Nombela-Arrieta C, Steinmetz LM, Trumpp A, Haas S. 2020. Combined single-cell and spatial transcriptomics reveal the molecular, cellular and spatial bone marrow niche organization. Nat Cell Biol 22: 38–48. 10.1038/s41556-019-0439-6
- ↵Baruzzo G, Cesaro G, Di Camillo B. 2022. Identify, quantify and characterize cellular communication from single-cell RNA sequencing data with scSeqComm. Bioinformatics 38: 1920–1929. 10.1093/bioinformatics/btac036
- ↵Boisset J-C, Vivié J, Grün D, Muraro MJ, Lyubimova A, van Oudenaarden A. 2018. Mapping the physical network of cellular interactions. Nat Methods 15: 547–553. 10.1038/s41592-018-0009-z
- ↵Browaeys R, Saelens W, Saeys Y. 2020. NicheNet: Modeling intercellular communication by linking ligands to target genes. Nat Methods 17: 159–162. 10.1038/s41592-019-0667-5
- ↵Cabello-Aguilar S, Alame M, Kon-Sun-Tack F, Fau C, Lacroix M, Colinge J. 2020. Singlecellsignalr: Inference of intercellular networks from single-cell transcriptomics. Nucleic Acids Res 48: e55. 10.1093/nar/gkaa183
- ↵Cang Z, Nie Q. 2020. Inferring spatial and signaling relationships between cells from single cell transcriptomic data. Nat Commun 11: 2084. 10.1038/s41467-020-15968-5
- ↵Cang Z, Zhao Y, Almet AA, Stabell A, Ramos R, Plikus MV, Atwood SX, Nie Q. 2023. Screening cell-cell communication in spatial transcriptomics via collective optimal transport. Nat Methods 20: 218–228. 10.1038/s41592-022-01728-4
- ↵Cheng J, Zhang J, Wu Z, Sun X. 2021. Inferring microenvironmental regulation of gene expression from single-cell RNA sequencing data using scMLnet with an application to COVID-19. Brief Bioinform 22: 988–1005. 10.1093/bib/bbaa327
- ↵Cheng J, Yan L, Nie Q, Sun X. 2022. Modeling spatial intercellular communication and multilayer signaling regulations using stMLnet. bioRxiv 10.1101/2022.06.27.497696
- ↵Cherry C, Maestas DR, Han J, Andorko JI, Cahan P, Fertig EJ, Garmire LX, Elisseeff JH. 2021. Computational reconstruction of the signalling networks surrounding implanted biomaterials from single-cell transcriptomics. Nat Biomed Eng 5: 1228–1238. 10.1038/s41551-021-00770-5
- ↵Cillo AR, Kürten CHL, Tabib T, Qi Z, Onkar S, Wang T, Liu A, Duvvuri U, Kim S, Soose RJ, 2020. Immune landscape of viral- and carcinogen-driven head and neck cancer. Immunity 52: 183–199.e9. 10.1016/j.immuni.2019.11.014
- ↵Deutsch EW, Lane L, Overall CM, Bandeira N, Baker MS, Pineau C, Moritz RL, Corrales F, Orchard S, Van Eyk JE, 2019. Human proteome project mass spectrometry data interpretation guidelines 3.0. J Proteome Res 18: 4108–4116. 10.1021/acs.jproteome.9b00542
- ↵Dimitrov D, Türei D, Garrido-Rodriguez M, Burmedi PL, Nagai JS, Boys C, Ramirez Flores RO, Kim H, Szalai B, Costa IG, 2022. Comparison of methods and resources for cell-cell communication inference from single-cell RNA-seq data. Nat Commun 13: 3224. 10.1038/s41467-022-30755-0
- ↵Dries R, Zhu Q, Dong R, Eng CL, Li H, Liu K, Fu Y, Zhao T, Sarkar A, Bao F, 2021. Giotto: a toolbox for integrative analysis and visualization of spatial expression data. Genome Biol 22: 78. 10.1186/s13059-021-02286-2
- ↵Efremova M, Vento-Tormo M, Teichmann SA, Vento-Tormo R. 2020. CellPhoneDB: Inferring cell-cell communication from combined expression of multisubunit ligand-receptor complexes. Nat Protoc 15: 1484–1506. 10.1038/s41596-020-0292-x
- ↵The FANTOM Consortium and the RIKEN PMI and CLST (DGT). 2014. A promoter-level mammalian expression atlas. Nature 507: 462–470. 10.1038/nature13182
- ↵Garcia-Alonso L, Handfield LF, Roberts K, Nikolakopoulou K, Fernando RC, Gardner L, Woodhams B, Arutyunyan A, Polanski K, Hoo R, 2021. Mapping the temporal and spatial dynamics of the human endometrium in vivo and in vitro. Nat Genet 53: 1698–1711. 10.1038/s41588-021-00972-2
- ↵Ghazanfar S, Lin Y, Su X, Lin DM, Patrick E, Han ZG, Marioni JC, Yang JYH. 2020. Investigating higher-order interactions in single-cell data with scHOT. Nat Methods 17: 799–806. 10.1038/s41592-020-0885-x
- ↵Hotamisligil GS. 2006. Inflammation and metabolic disorders. Nature 444: 860–867. 10.1038/nature05485
- ↵Hou R, Denisenko E, Ong HT, Ramilowski JA, Forrest ARR. 2020. Predicting cell-to-cell communication networks using NATMI. Nat Commun 11: 5011. 10.1038/s41467-020-18873-z
- ↵Hu Y, Peng T, Gao L, Tan K. 2021. CytoTalk: de novo construction of signal transduction networks using single-cell transcriptomic data. Sci Adv 7: eabf1356. 10.1126/sciadv.abf1356
- ↵Jaitin DA, Weiner A, Yofe I, Lara-Astiaso D, Keren-Shaul H, David E, Salame TM, Tanay A, van Oudenaarden A, Amit I. 2016. Dissecting immune circuits by linking CRISPR-pooled screens with single-cell RNA-seq. Cell 167: 1883–1896.e15. 10.1016/j.cell.2016.11.039
- ↵Jakobsson JET, Spjuth O, Lagerström MC. 2021. scConnect: a method for exploratory analysis of cell–cell communication based on single-cell RNA-sequencing data. Bioinformatics 37: 3501–3508. 10.1093/bioinformatics/btab245
- ↵Jin S, Ramos R. 2022. Computational exploration of cellular communication in skin from emerging single-cell and spatial transcriptomic data. Biochem Soc Trans 50: 297–308. 10.1042/BST20210863
- ↵Jin S, Guerrero-Juarez CF, Zhang L, Chang I, Ramos R, Kuan CH, Myung P, Plikus MV, Nie Q. 2021. Inference and analysis of cell-cell communication using CellChat. Nat Commun 12: 1088. 10.1038/s41467-021-21246-9
- ↵Kleshchevnikov V, Shmatko A, Dann E, Aivazidis A, King HW, Li T, Elmentaite R, Lomakin A, Kedlian V, Gayoso A, 2022. Cell2location maps fine-grained cell types in spatial transcriptomics. Nat Biotechnol 40: 661–671. 10.1038/s41587-021-01139-4
- ↵Kuppe C, Ramirez Flores RO, Li Z, Hayat S, Levinson RT, Liao X, Hannani MT, Tanevski J, Wünnemann F, Nagai JS, 2022. Spatial multiomic map of human myocardial infarction. Nature 608: 766–777. 10.1038/s41586-022-05060-x
- ↵Lee MC, Lopez-Diaz FJ, Khan SY, Tariq MA, Dayn Y, Vaske CJ, Radenbaugh AJ, Kim HJ, Emerson BM, Pourmand N. 2014. Single-cell analyses of transcriptional heterogeneity during drug tolerance transition in cancer cells by RNA sequencing. Proc Natl Acad Sci 111: E4726–E4735.
- ↵Li B, Zhang W, Guo C, Xu H, Li L, Fang M, Hu Y, Zhang X, Yao X, Tang M, 2022. Benchmarking spatial and single-cell transcriptomics integration methods for transcript distribution prediction and cell type deconvolution. Nat Methods 19: 662–670. 10.1038/s41592-022-01480-9
- ↵Li H, Ma T, Hao M, Guo W, Gu J, Zhang X, Wei L. 2023a. Decoding functional cell–cell communication events by multi-view graph learning on spatial transcriptomics. Brief Bioinform 24: bbad359. 10.1093/bib/bbad359
- ↵Li Z, Wang T, Liu P, Huang Y. 2023b. SpatialDM for rapid identification of spatially coexpressed ligand–receptor and revealing cell–cell communication patterns. Nat Commun 14: 3995. 10.1038/s41467-023-39608-w
- ↵Liu Z, Sun D, Wang C. 2022. Evaluation of cell-cell interaction methods by integrating single-cell RNA sequencing data with spatial information. Genome Biol 23: 218. 10.1186/s13059-022-02783-y
- ↵Livesey FJ, Cepko CL. 2001. Vertebrate neural cell-fate determination: lessons from the retina. Nat Rev Neurosci 2: 109–118. 10.1038/35053522
- ↵Longo SK, Guo MG, Ji AL, Khavari PA. 2021. Integrating single-cell and spatial transcriptomics to elucidate intercellular tissue dynamics. Nat Rev Genet 22: 627–644. 10.1038/s41576-021-00370-8
- ↵Marx V. 2021. Method of the year: Spatially resolved transcriptomics. Nat Methods 18: 9–14. 10.1038/s41592-020-01033-y
- ↵Meyer PE. 2008. “Information-theoretic variable selection and network inference from microarray data.” PhD thesis, Universite Libre de Bruxelles, Brussels.
- ↵Mimitou EP, Lareau CA, Chen KY, Zorzetto-Fernandes AL, Hao Y, Takeshima Y, Luo W, Huang TS, Yeung BZ, Papalexi E, 2021. Scalable, multimodal profiling of chromatin accessibility, gene expression and protein levels in single cells. Nat Biotechnol 39: 1246–1258. 10.1038/s41587-021-00927-2
- ↵Noël F, Massenet-Regad L, Carmi-Levy I, Cappuccio A, Grandclaudon M, Trichot C, Kieffer Y, Mechta-Grigoriou F, Soumelis V. 2021. Dissection of intercellular communication using the transcriptome-based framework ICELLNET. Nat Commun 12: 1089. 10.1038/s41467-021-21244-x
- ↵Palla G, Fischer DS, Regev A, Theis FJ. 2022. Spatial components of molecular tissue biology. Nat Biotechnol 40: 308–318. 10.1038/s41587-021-01182-1
- ↵Parsons JT, Horwitz AR, Schwartz MA. 2010. Cell adhesion: Integrating cytoskeletal dynamics and cellular tension. Nat Rev Mol Cell Biol 11: 633–643. 10.1038/nrm2957
- ↵Pham D, Tan X, Xu J, Grice LF, Lam PY, Raghubar A, Vukovic J, Ruitenberg MJ, Nguyen Q. 2020. stLearn: integrating spatial location, tissue morphology and gene expression to find cell types, cell-cell interactions and spatial trajectories within undissociated tissues. bioRxiv 10.1101/2020.05.31.125658
- ↵Quail DF, Bowman RL, Akkari L, Quick ML, Schuhmacher AJ, Huse JT, Holland EC, Sutton JC, Joyce JA. 2016. The tumor microenvironment underlies acquired resistance to CSF-1R inhibition in gliomas. Science 352: aad3018. 10.1126/science.aad3018
- ↵Ramilowski JA, Goldberg T, Harshbarger J, Kloppmann E, Lizio M, Satagopam VP, Itoh M, Kawaji H, Carninci P, Rost B, 2015. A draft network of ligand-receptor-mediated multicellular signalling in human. Nat Commun 6: 7866. 10.1038/ncomms8866
- ↵Raredon MSB, Yang J, Garritano J, Wang M, Kushnir D, Schupp JC, Adams TS, Greaney AM, Leiby KL, Kaminski N, 2022. Computation and visualization of cell-cell signaling topologies in single-cell systems data using connectome. Sci Rep 12: 4187. 10.1038/s41598-022-07959-x
- ↵Ravi VM, Will P, Kueckelhaus J, Sun N, Joseph K, Salié H, Vollmer L, Kuliesiute U, von Ehr J, Benotmane JK, 2022. Spatially resolved multiomics deciphers bidirectional tumor-host interdependence in glioblastoma. Cancer Cell 40: 639–655.e13. 10.1016/j.ccell.2022.05.009
- ↵R Core Team. 2021. R: a language and environment for statistical computing. R Foundation for Statistical Computing, Vienna. https://www.R-project.org/.
- ↵Rieckmann JC, Geiger R, Hornburg D, Wolf T, Kveler K, Jarrossay D, Sallusto F, Shen-Orr SS, Lanzavecchia A, Mann M, 2017. Social network architecture of human immune cells unveiled by quantitative proteomics. Nat Immunol 18: 583–593. 10.1038/ni.3693
- ↵Ritchie ME, Phipson B, Wu D, Hu Y, Law CW, Shi W, Smyth GK. 2015. limma powers differential expression analyses for RNA-sequencing and microarray studies. Nucleic Acids Res 43: e47. 10.1093/nar/gkv007
- ↵Saito T, Rehmsmeier M. 2015. The precision-recall plot is more informative than the ROC plot when evaluating binary classifiers on imbalanced data sets. PLoS One 10: e0118432. 10.1371/journal.pone.0118432
- ↵Saito T, Rehmsmeier M. 2017. Precrec: Fast and accurate precision–recall and ROC curve calculations in R. Bioinformatics 33: 145–147. 10.1093/bioinformatics/btw570
- ↵Satpathy AT, Granja JM, Yost KE, Qi Y, Meschi F, McDermott GP, Olsen BN, Mumbach MR, Pierce SE, Corces MR, 2019. Massively parallel single-cell chromatin landscapes of human immune cell development and intratumoral T cell exhaustion. Nat Biotechnol 37: 925–936. 10.1038/s41587-019-0206-z
- ↵Sing T, Sander O, Beerenwinkel N, Lengauer T. 2005. ROCR: Visualizing classifier performance in R. Bioinformatics 21: 3940–3941. 10.1093/bioinformatics/bti623
- ↵Solovey M, Scialdone A. 2020. COMUNET: A tool to explore and visualize intercellular communication. Bioinformatics 36: 4296–4300. 10.1093/bioinformatics/btaa482
- ↵Srivatsan SR, Regier MC, Barkan E, Franks JM, Packer JS, Grosjean P, Duran M, Saxton S, Ladd JJ, Spielmann M, 2021. Embryo-scale, single-cell spatial transcriptomics. Science 373: 111–117. 10.1126/science.abb9536
- ↵Stoeckius M, Hafemeister C, Stephenson W, Houck-Loomis B, Chattopadhyay PK, Swerdlow H, Satija R, Smibert P. 2017. Simultaneous epitope and transcriptome measurement in single cells. Nat Methods 14: 865–868. 10.1038/nmeth.4380
- ↵Tanevski J, Flores ROR, Gabor A, Schapiro D, Saez-Rodriguez J. 2022. Explainable multiview framework for dissecting spatial relationships from highly multiplexed data. Genome Biol 23: 97. 10.1186/s13059-022-02663-5
- ↵Tian R. 2014. Exploring intercellular signaling by proteomic approaches. Proteomics 14: 498–512. 10.1002/pmic.201300259
- ↵Tsuyuzaki K, Ishii M, Nikaido I. 2019. Uncovering hypergraphs of cell-cell interaction from single cell RNA-sequencing data. bioRxiv 10.1101/566182
- ↵Tyler SR, Rotti PG, Sun X, Yi Y, Xie W, Winter MC, Flamme-Wiese MJ, Tucker BA, Mullins RF, Norris AW, 2019. PyMINEr finds gene and autocrine-paracrine networks from human islet scRNA-seq. Cell Rep 26: 1951–1964.e8 10.1016/j.celrep.2019.01.063
- ↵Wang S, Karikomi M, MacLean AL, Nie Q. 2019a. Cell lineage and communication network inference via optimization for single-cell transcriptomics. Nucleic Acids Res 47: e66. 10.1093/nar/gkz204
- ↵Wang Y, Wang R, Zhang S, Song S, Jiang C, Han G, Wang M, Ajani J, Futreal A, Wang L. 2019b. iTALK: an R package to characterize and illustrate intercellular communication. bioRxiv 10.1101/507871
- ↵Wilk AJ, Shalek AK, Holmes S, Blish CA. 2023. Comparative analysis of cell–cell communication at single-cell resolution. Nat Biotechnol 10.1038/s41587-023-01782-z
- ↵Wu SZ, Al-Eryani G, Roden DL, Junankar S, Harvey K, Andersson A, Thennavan A, Wang C, Torpy JR, Bartonicek N, 2021. A single-cell and spatially resolved atlas of human breast cancers. Nat Genet 53: 1334–1347. 10.1038/s41588-021-00911-1
- ↵Yan L, Sun X. 2023. Benchmarking and integration of methods for deconvoluting spatial transcriptomic data. Bioinformatics 39: btac805. 10.1093/bioinformatics/btac805
- ↵Zhang J, Guan M, Wang Q, Zhang J, Zhou T, Sun X. 2020. Single-cell transcriptome-based multilayer network biomarker for predicting prognosis and therapeutic response of gliomas. Brief Bioinform 21: 1080–1097. 10.1093/bib/bbz040
- ↵Zhang Y, Liu T, Hu X, Wang M, Wang J, Zou B, Tan P, Cui T, Dou Y, Ning L, 2021. CellCall: integrating paired ligand–receptor and transcription factor activities for cell–cell communication. Nucleic Acids Res 49: 8520–8534. 10.1093/nar/gkab638