
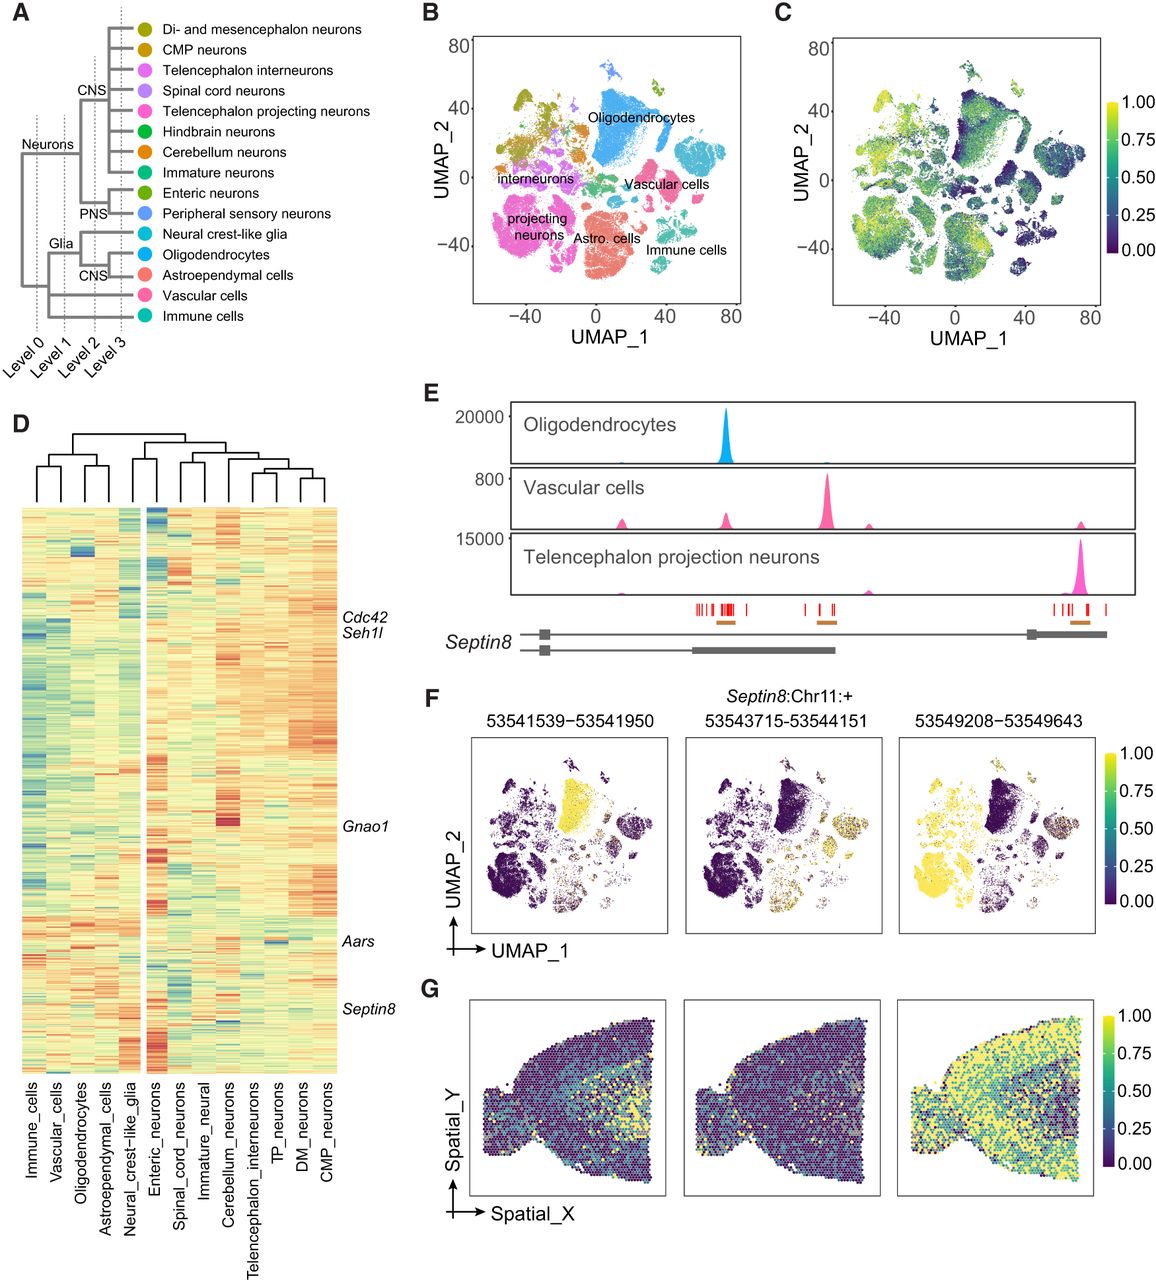
Cell class–specific PAs in the adult mouse brain. (A) Major cell classes in the adult mouse brain data set (Zeisel et al. 2018), showing four levels of hierarchy. (B) UMAP showing main level-3 cell types replotted from a previous study (Zeisel et al. 2018). The clusters are color-coded the same way as cell types in A. (C) UMAP showing transcriptome-wide average WARM values across cells. For each cell, the WARM values over all multipeak 3′ UTRs were averaged using equal weights. (D) Heat map showing cell type–level WARM values for significant differential APA transcripts among level-3 cell types. The dendrogram shows unsupervised clustering for cell types. Selected genes are labeled. The vertical white reference line indicates the separation of neurons and nonneuron cells. (E) Coverage plots of Septin8 for oligodendrocytes, vascular cells, and telencephalon projecting neurons. The three peaks and associated PAs are indicated. The cell-type color codes are the same as A,B. (F) Relative expression patterns of three Septin8 PAs identified by Infernape. The colors indicate the UMI counts proportion within each cell for the indicated peaks. (G) Expression of three Septin8 PAs in the brain. The expression levels were standardized to [0, 1].


