
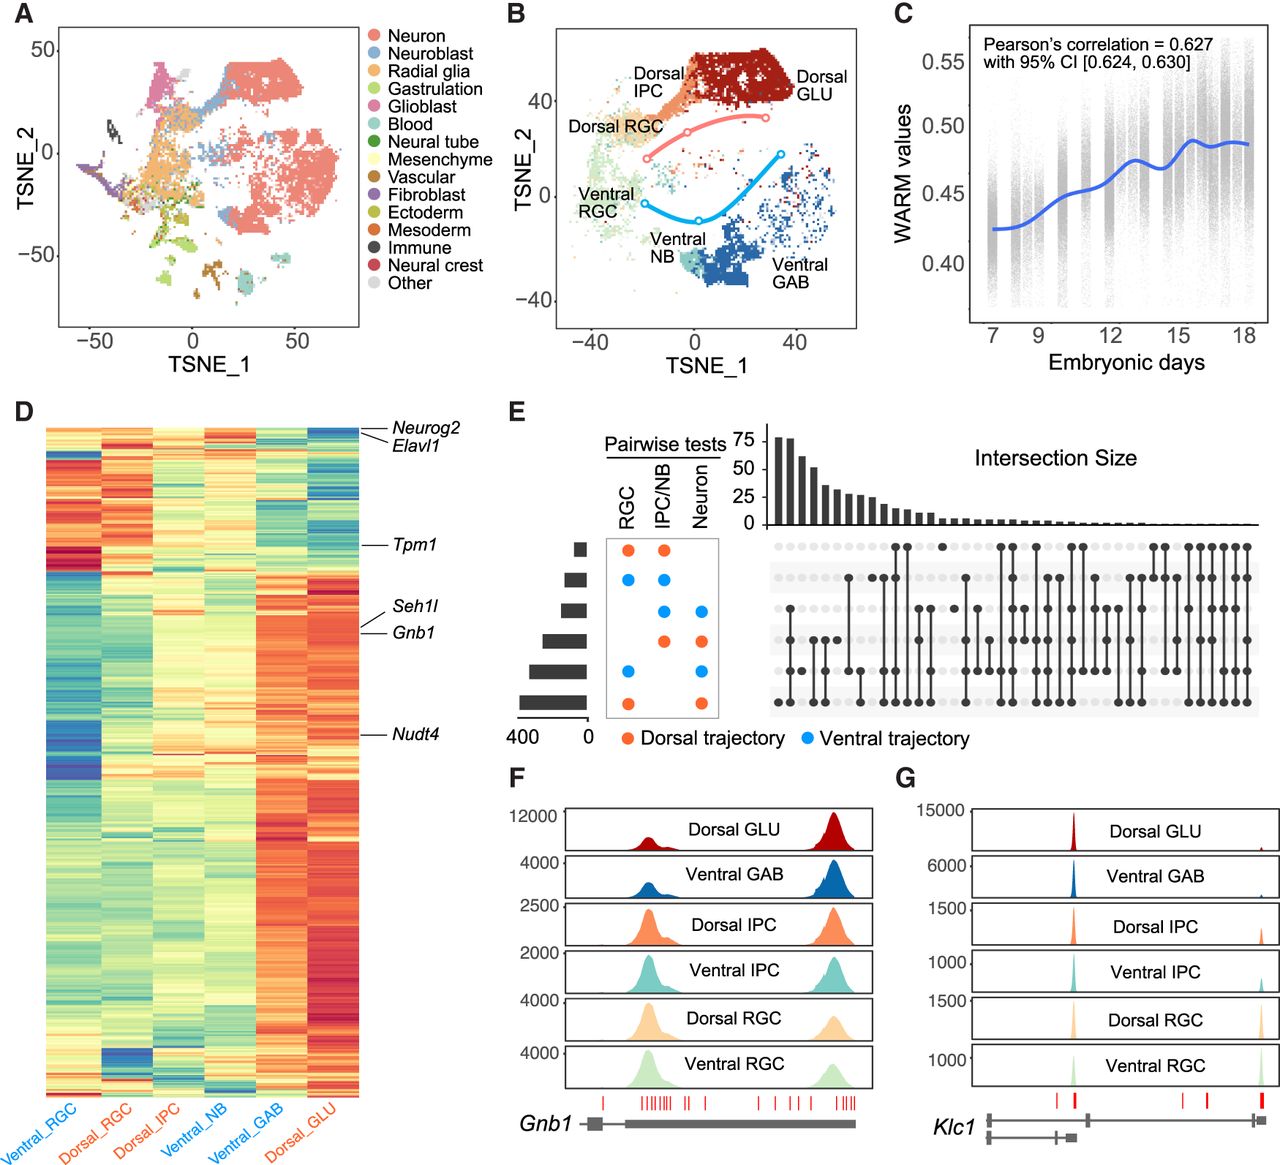
Dynamic PAs during dorsal excitatory and ventral inhibitory neurogenesis. (A) t-SNE plot showing the main cell types of the developing mouse brain from E7.5 through E18.5. Data were replotted from a previous study using original coordinates and cell-type labels (La Manno et al. 2021). (B) Neurogenesis trajectories for dorsal excitatory and ventral inhibitory neurons, respectively. (GLU) Glutamatergic neurons, (GAB) GABAergic neurons, (NB) neuroblast. (C) WARM values of single cells across sampling time showing significant 3′-UTR lengthening in brain development. (CI) Confidence interval. (D) Heat map of WARM values (within-UTR-level tests) showing shared APA events among comparisons for cell types in dorsal excitatory and ventral inhibitory neurogenesis trajectories. (E) UpSet plot for differential APA events showing shared changes among comparisons for cell types in dorsal excitatory and ventral inhibitory neurogenesis trajectories. (F) Coverage plot for Gnb1 showing that Glu and GABA neurons tend to use the distal PA. (G) Coverage plot for Klc1 IPA showing that Glu and GABA neurons primarily use the proximal PA.


