
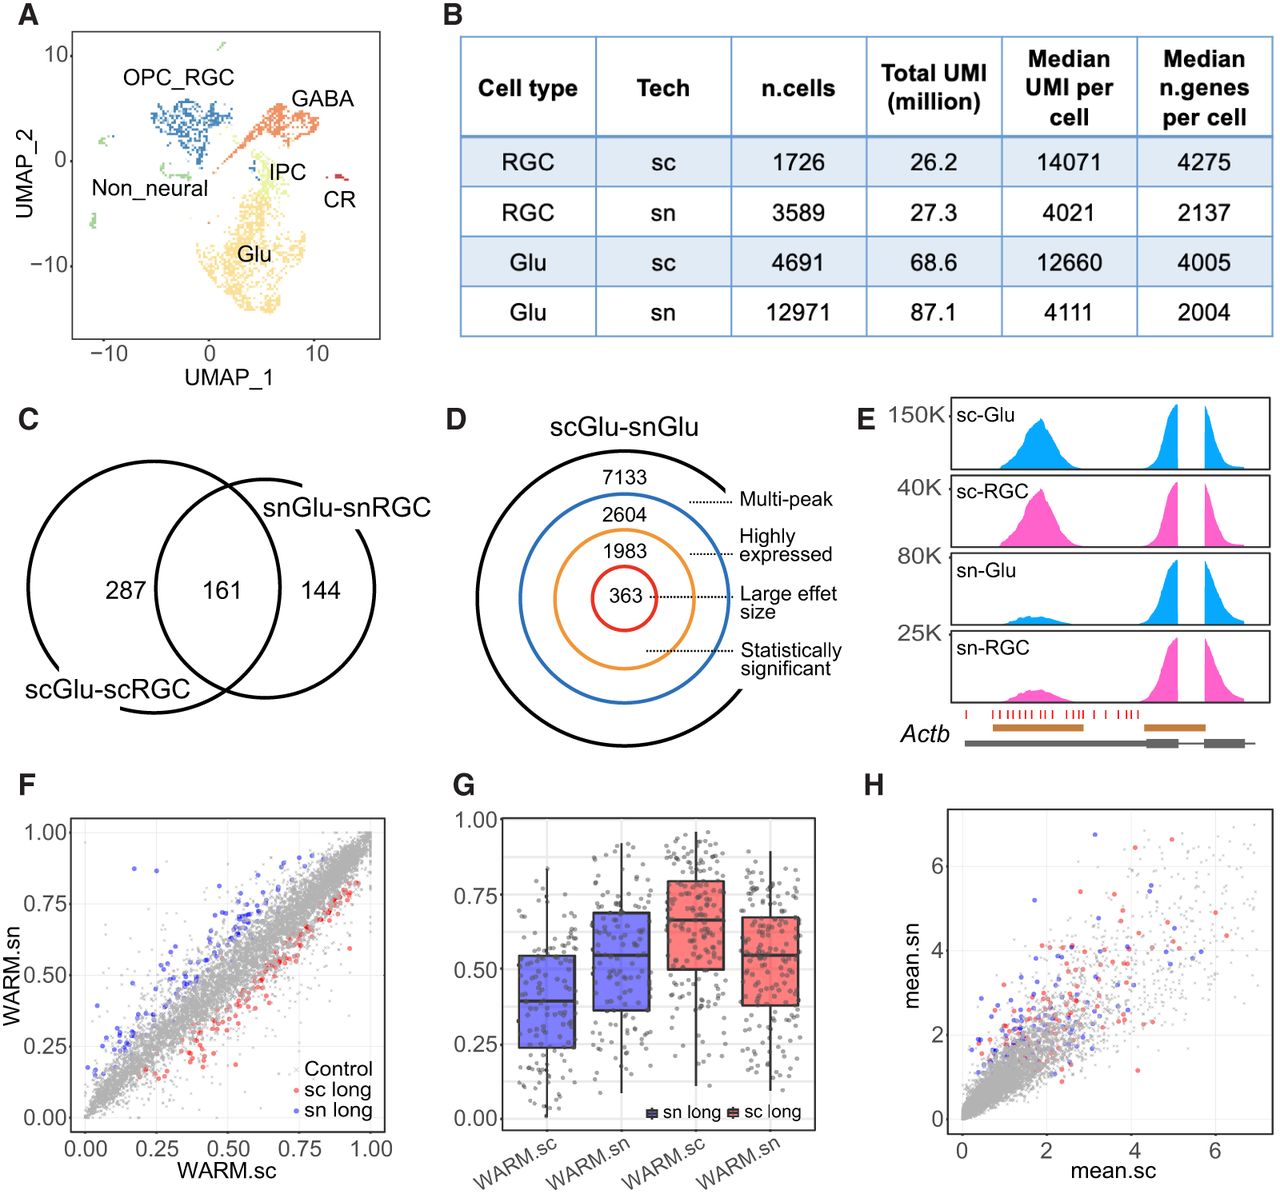
Differential PA discovery between scRNA-seq and snRNA-seq data. (A) UMAP showing six main cell types in the E18.5 mouse brain scRNA-seq data. (Glu) Glutamatergic neurons, (GABA) GABAergic interneurons, (IPC) intermediate progenitor cells, (OPC_RGC) oligodendrocyte precursor and radial glial cells, (CR) Cajal–Retzius cells. (B) Summary statistics for E18.5 mouse brain scRNA-seq and snRNA-seq data showing comparable total UMIs between two different data sets for both RGC (OPC_RGC) and Glu cells. (C) Venn diagram showing the numbers of significant differential PA genes between scGlu-scRGC (448 genes) and snGlu-snRGC (305 genes). (D) Decomposition of the number of significant differential PA genes for the Glu population between scRNA-seq and snRNA-seq (scGlu–snGlu). (E) Coverage plot of Actb, one of the top significant differential APA genes in the comparison of scRNA-seq versus snRNA-seq. Annotated PAs (red ticks) and peak regions (brown bars) by Inferenape are also shown. (F) Scatter plot showing WARM values for each transcript in the comparison of scGlu versus snGlu. Nonsignificant transcripts are labeled in gray, and significant transcripts are colored red (lengthening in scRNA-seq) or blue (lengthening in snRNA-seq). (G) Box plots showing the distribution of WARM values for significant transcripts in single-cell and single-nucleus data sets, respectively. The color codes are consistent with that in F. (H) Scatter plot showing average scaled gene expression for each transcript in F. The shape and color codes are the same as F.


