
Figure 5.
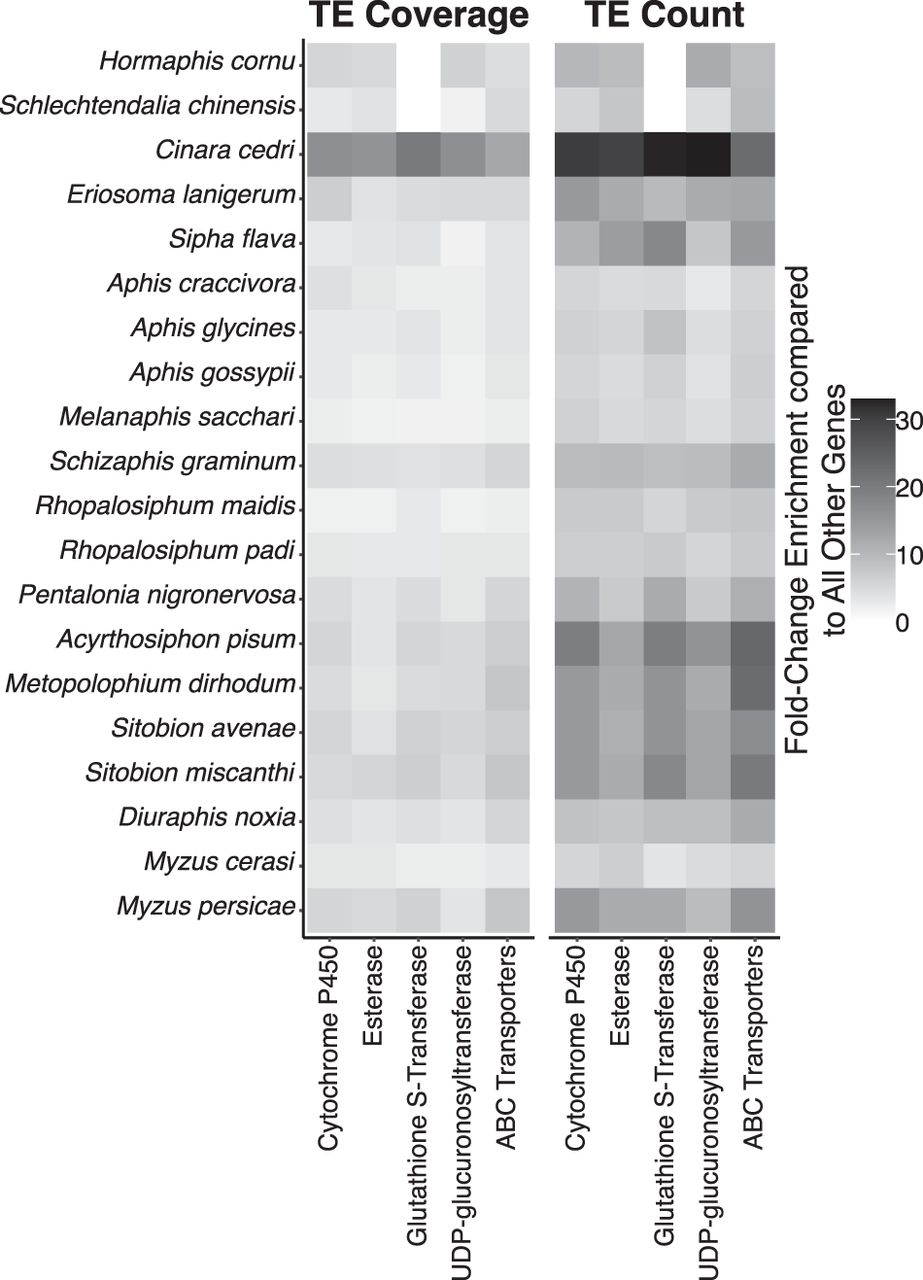
TE enrichment at XGFs compared with genome-wide levels. Fold-change enrichment for TE coverage and TE count at XGFs compared with within-genome levels at non-XGFs across 20 aphid species.
(Downloading may take up to 30 seconds. If the slide opens in your browser, select File -> Save As to save it.)
Click on image to view larger version.
TE enrichment at XGFs compared with genome-wide levels. Fold-change enrichment for TE coverage and TE count at XGFs compared with within-genome levels at non-XGFs across 20 aphid species.
 CiteULike
 Delicious
 Digg
Digg Facebook
 Google+
 Reddit
 Twitter
