
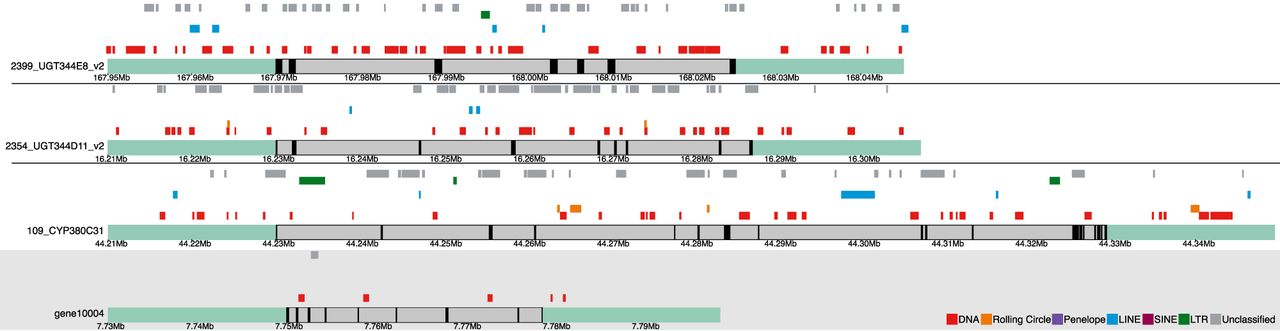
Karyoplots illustrating the most TE-dense XGF loci, corresponding to the XGFs highlighted in bold in Table 2. For comparison, the gene region represented in the shaded box (gene10004) shows a non-XGF from M. persicae with representative TE coverage close to the mean for non-XGFs (1519 bp). XGFs 125_CYP380C52 and 105_CYP380C19 are not shown, as these are nested at the CYP cluster containing 109_CYP380C31. Sea green–shaded regions indicate gene-flanking regions. Gray bars represent gene bodies, and black bars show exonic regions. TEs are annotated above their respective gene tracks, with colors indicating the main TE classifications, as depicted in the key at the bottom of the figure.


