
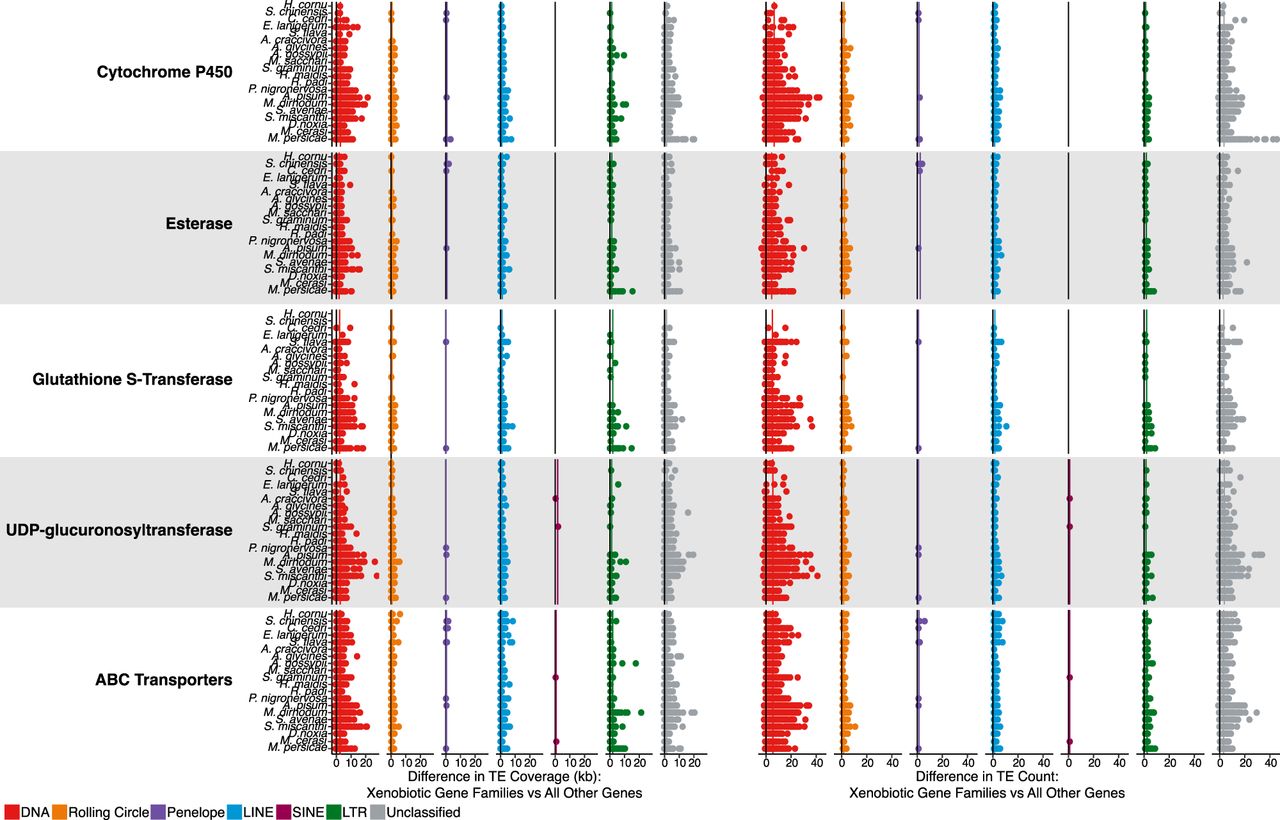
Figure 3.
Differences in TE coverage and TE count at XGFs compared with all other host genes. Coverage and count of genic (exon and intron) XGF sequence plus flanking regions (20 kb directly upstream of or downstream from the gene body) are shown. Each point represents a single XGF locus. Black lines indicate the expected TE coverage difference whereby XGFs and other genes are equally enriched for TEs (i.e., zero enrichment). Colored lines indicate species mean coverage and count for each XGF locus and TE type. Major TE classifications are indicated by the colors in the key.


