
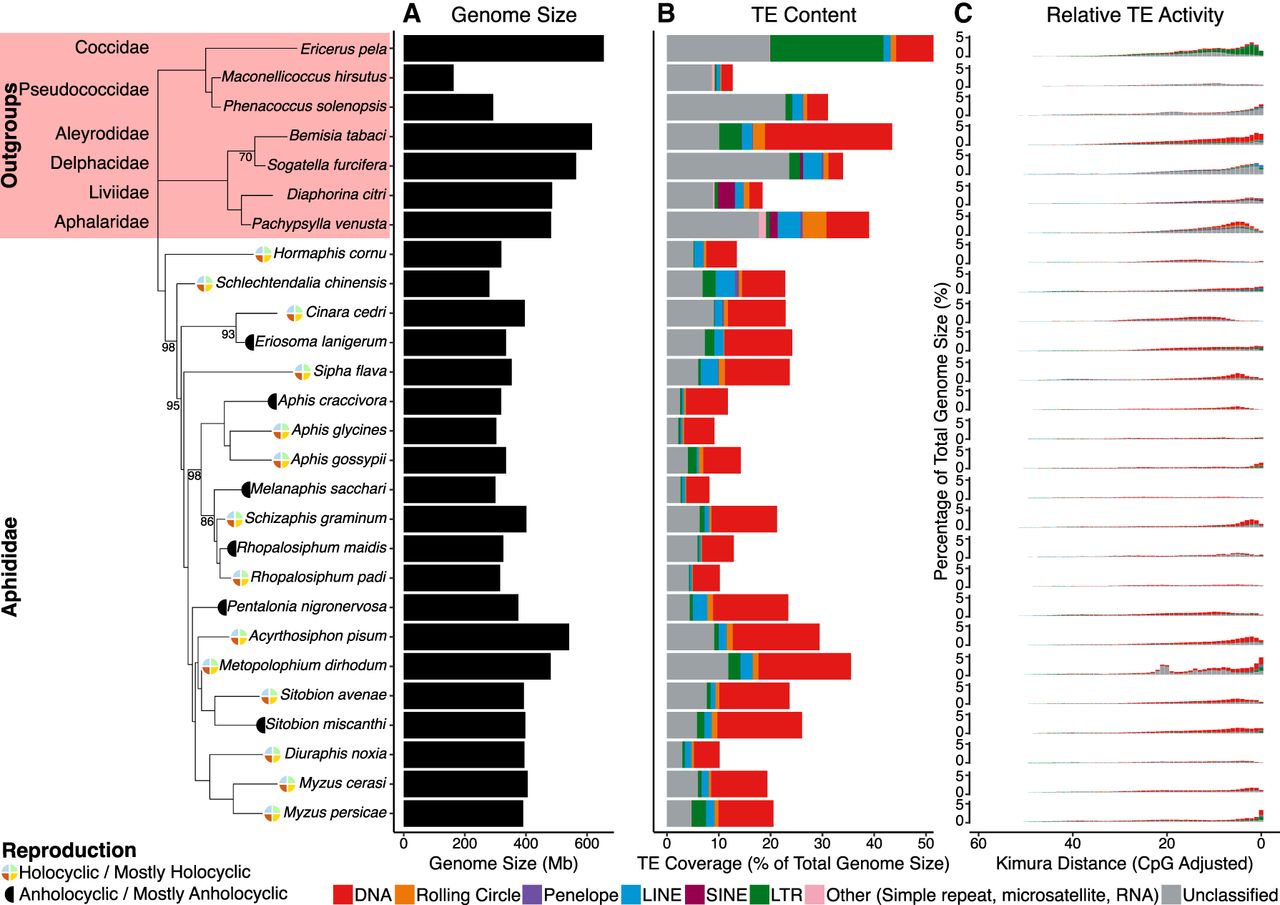
Summary of TE content and activity in aphid genomes, plotted in phylogenetic order. Nodes in the aphid phylogeny with bootstrap support less than 100 are labeled. Reproductive mode (Van Emden and Harrington 2017) is labeled next to species names. Genome size is represented by the black bars (A). TE content is expressed as a percentage of total genome size for each species, with major TE classifications represented by the colors indicated in the key (B). Kimura two-parameter distance (CpG adjusted) from each TE family consensus is used as a proxy for relative TE activity (C), where a lower Kimura distance indicates more recent TE activity. Because of challenges with accurately estimating TE age, divergence from consensus better reflects relative TE activity, with lower Kimura distances signaling more recent TE activity. Activity is organized such that recent TE activity is toward the RHS of the x-axis.


